
Image caption
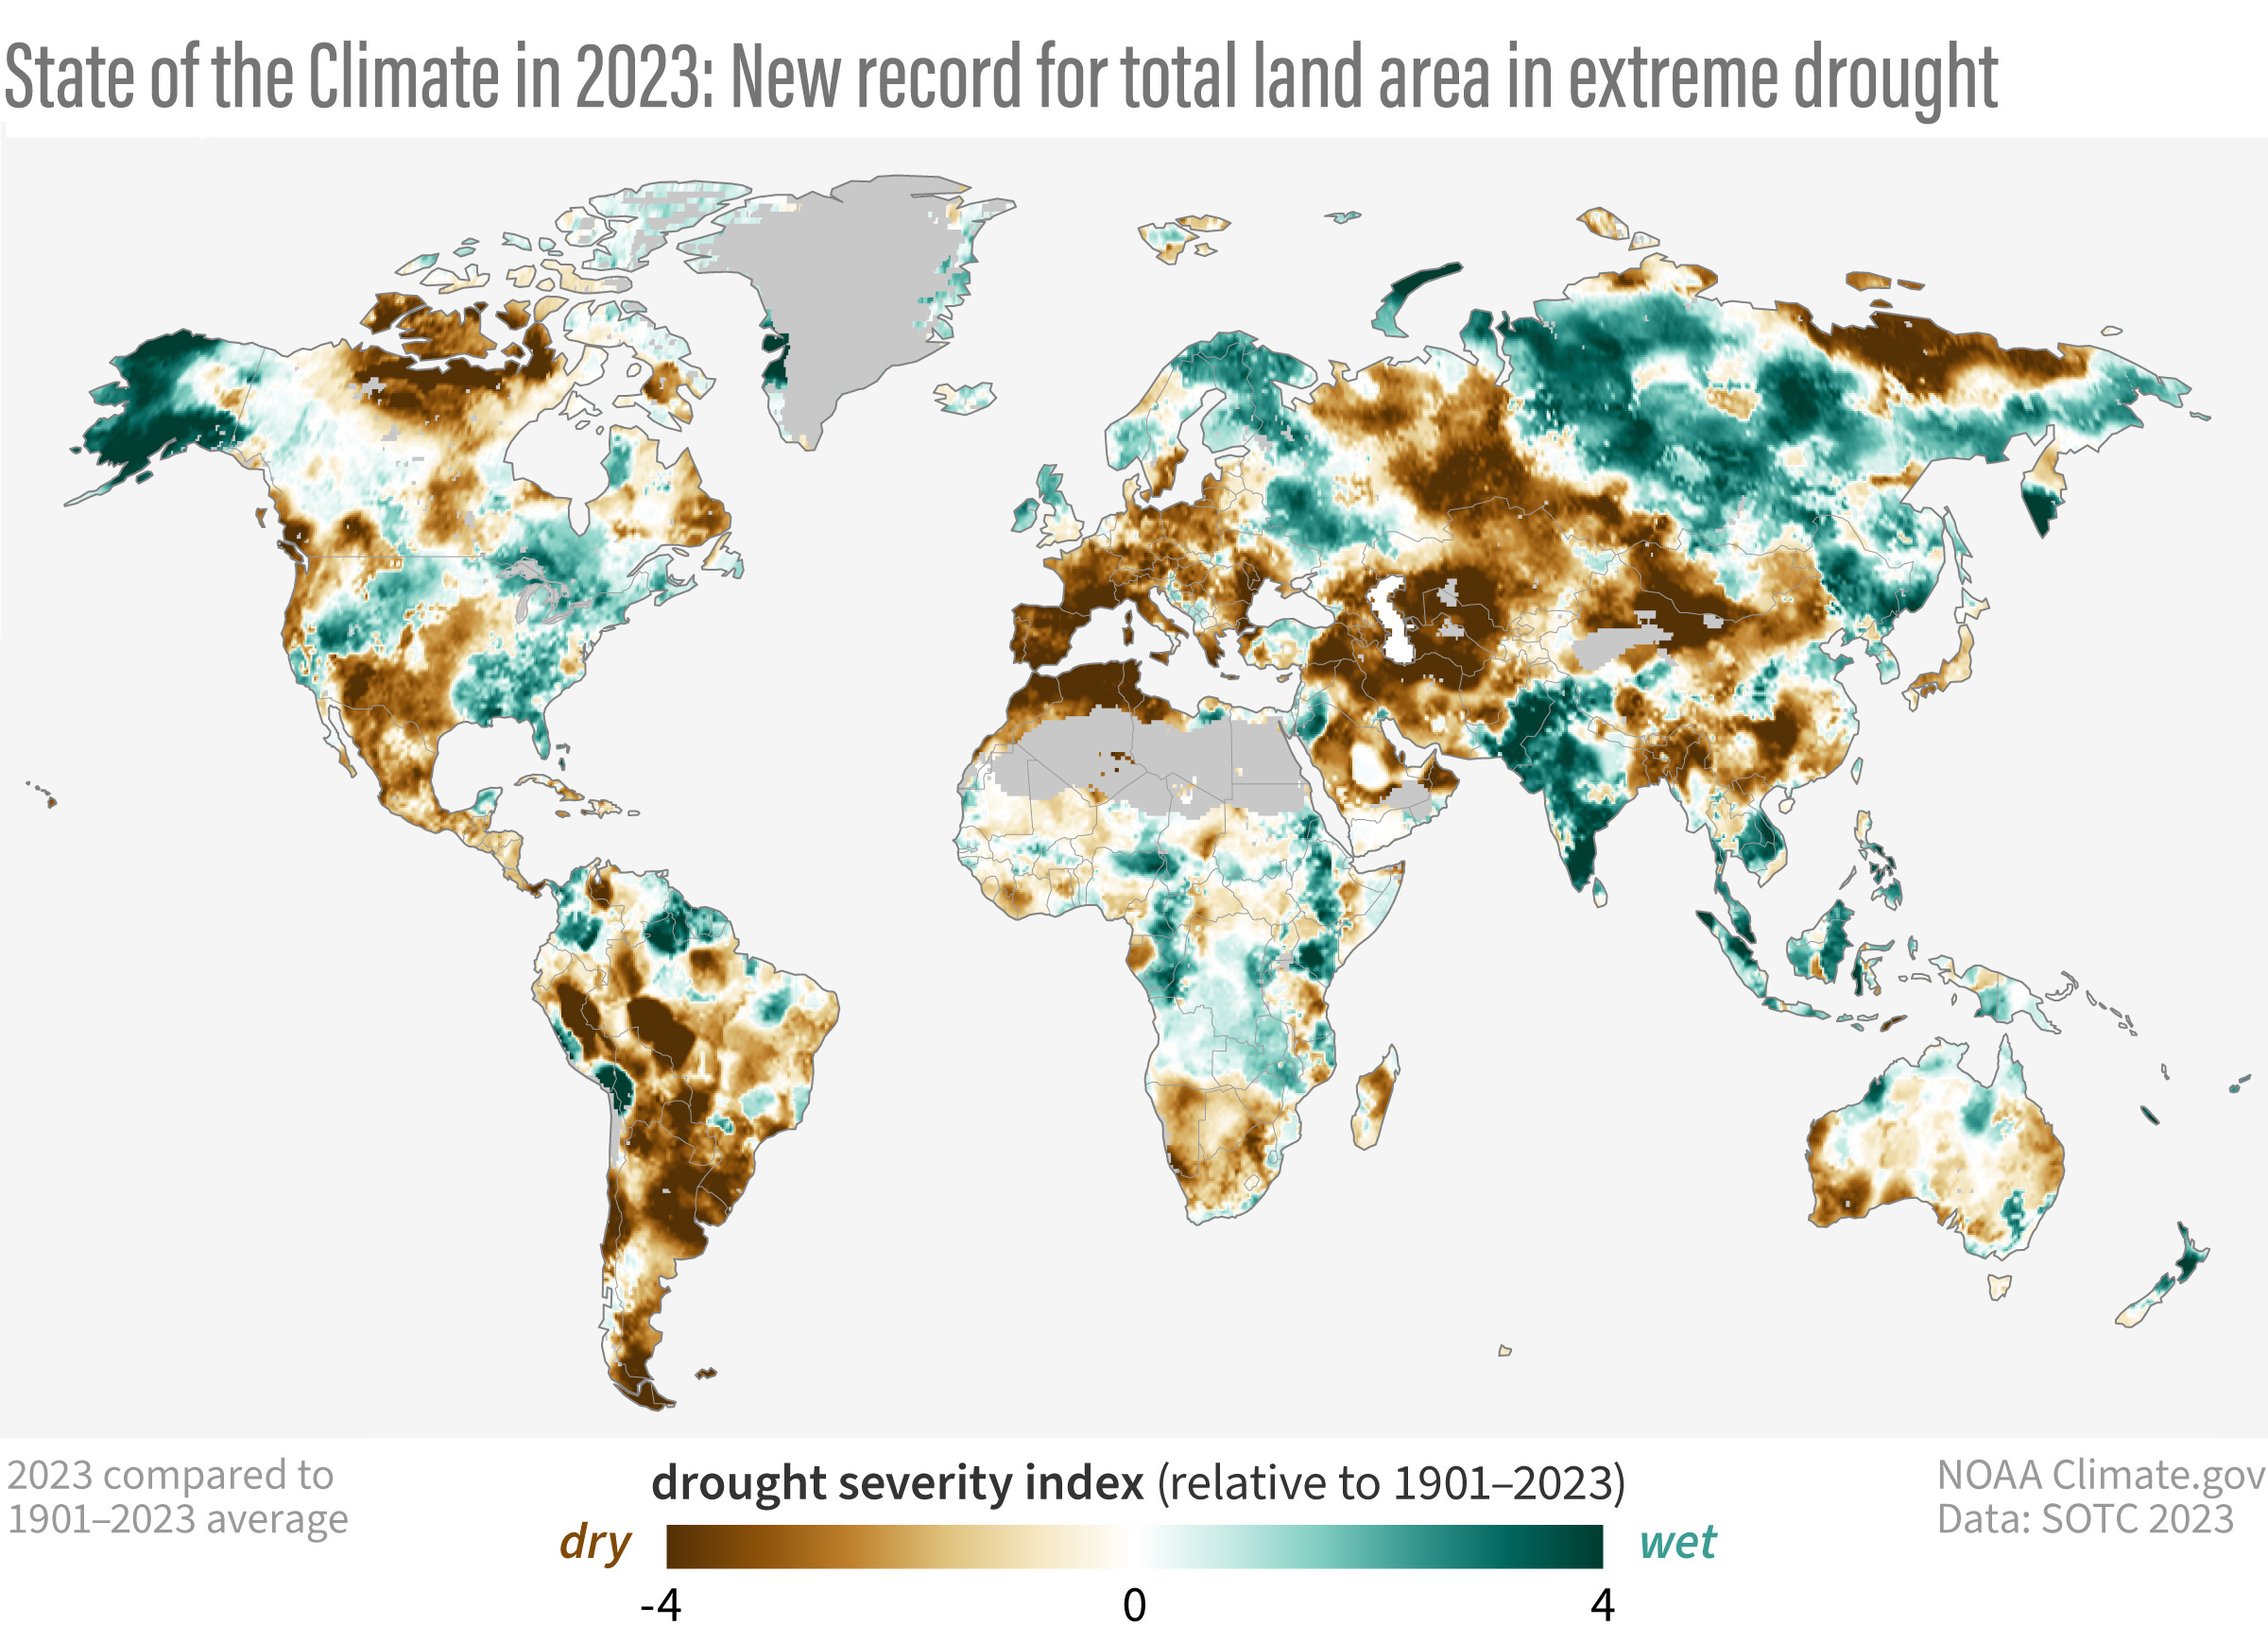
This map shows global drought status in 2023 based on a scale called the Palmer Self-calibrating Drought Index. Areas experiencing the most extreme drought are darkest brown; places that were extremely wet over the year are colored dark blue green. Nearly 8 percent of the global land area experienced extreme drought in 2023—a new record. NOAA Climate.gov image, adapted from State of the Climate in 2023, Plate 2.1(s).