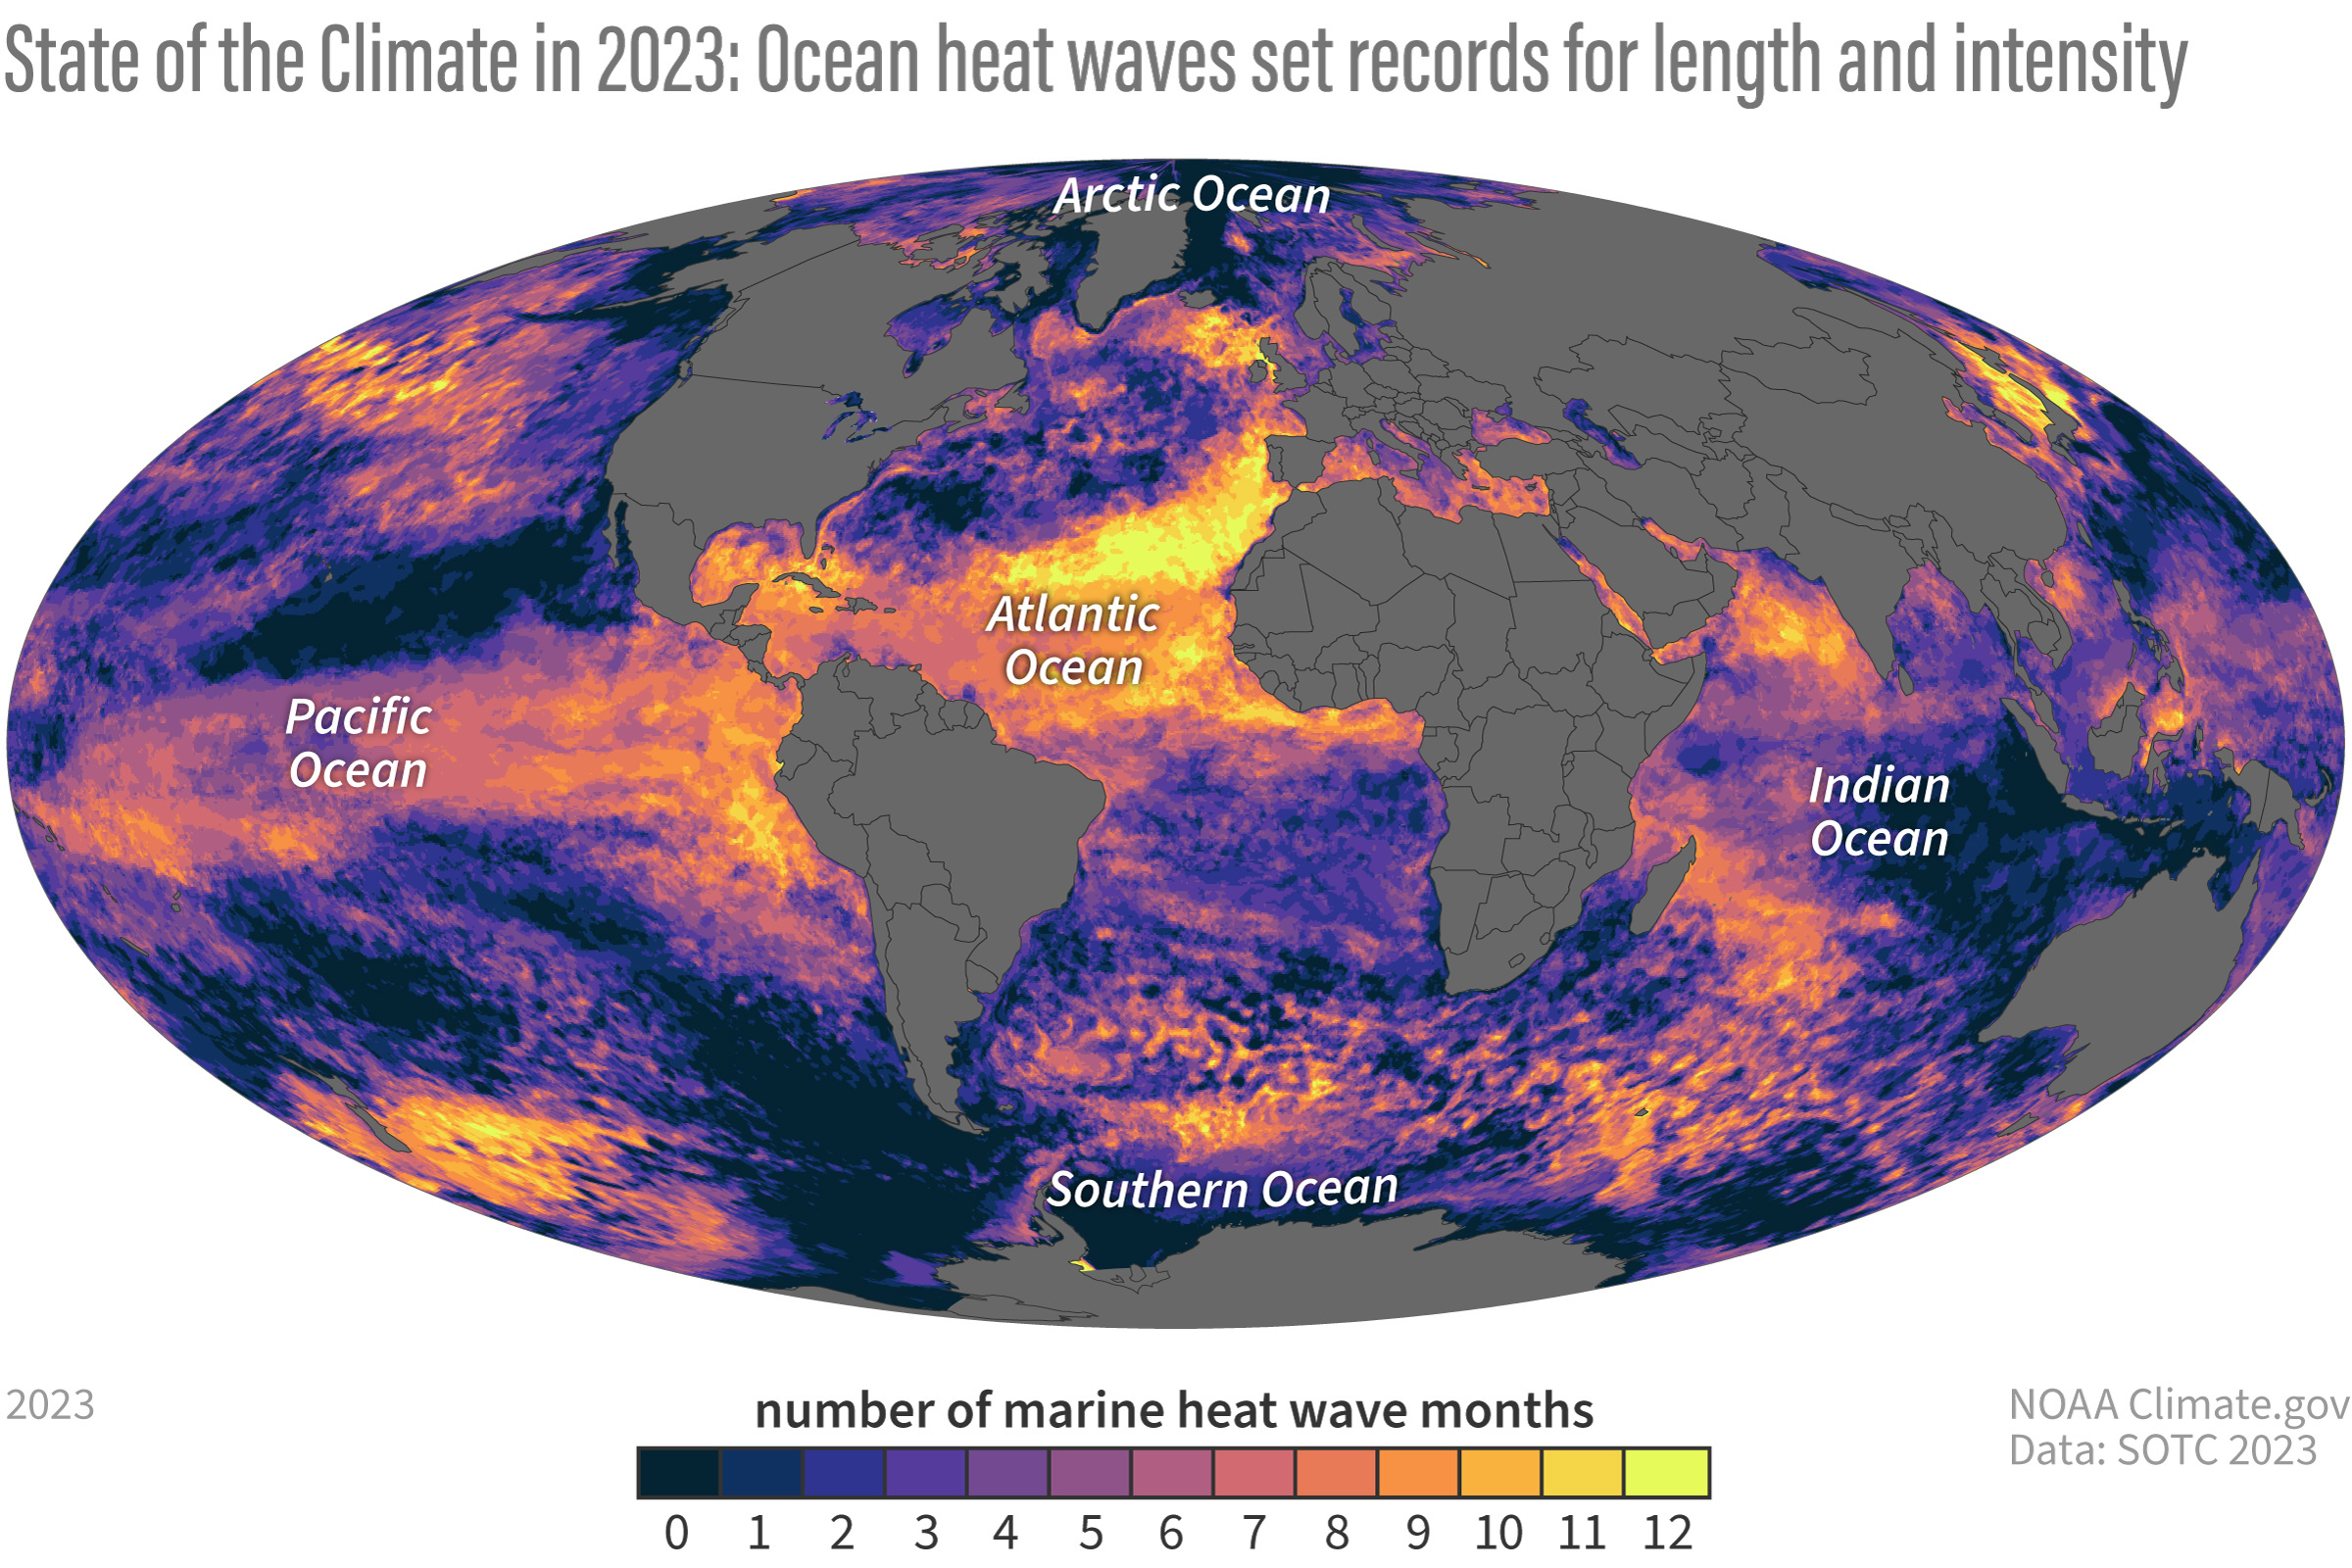
Image caption
This map shows the number of months each part of the global ocean experienced heat wave conditions in 2023, meaning that for a given time of year, the monthly average temperatures were in the hottest 10 percent of all monthly temperatures from 1991-2020. Very few areas experienced less than one full month of heat wave conditions (darkest blue). Relatively large swaths of the eastern North Atlantic experienced heat wave conditions virtually all year (bright yellow). NOAA Climate.gov image, adapted from Figure SB3.1 in State of the Climate in 2023.