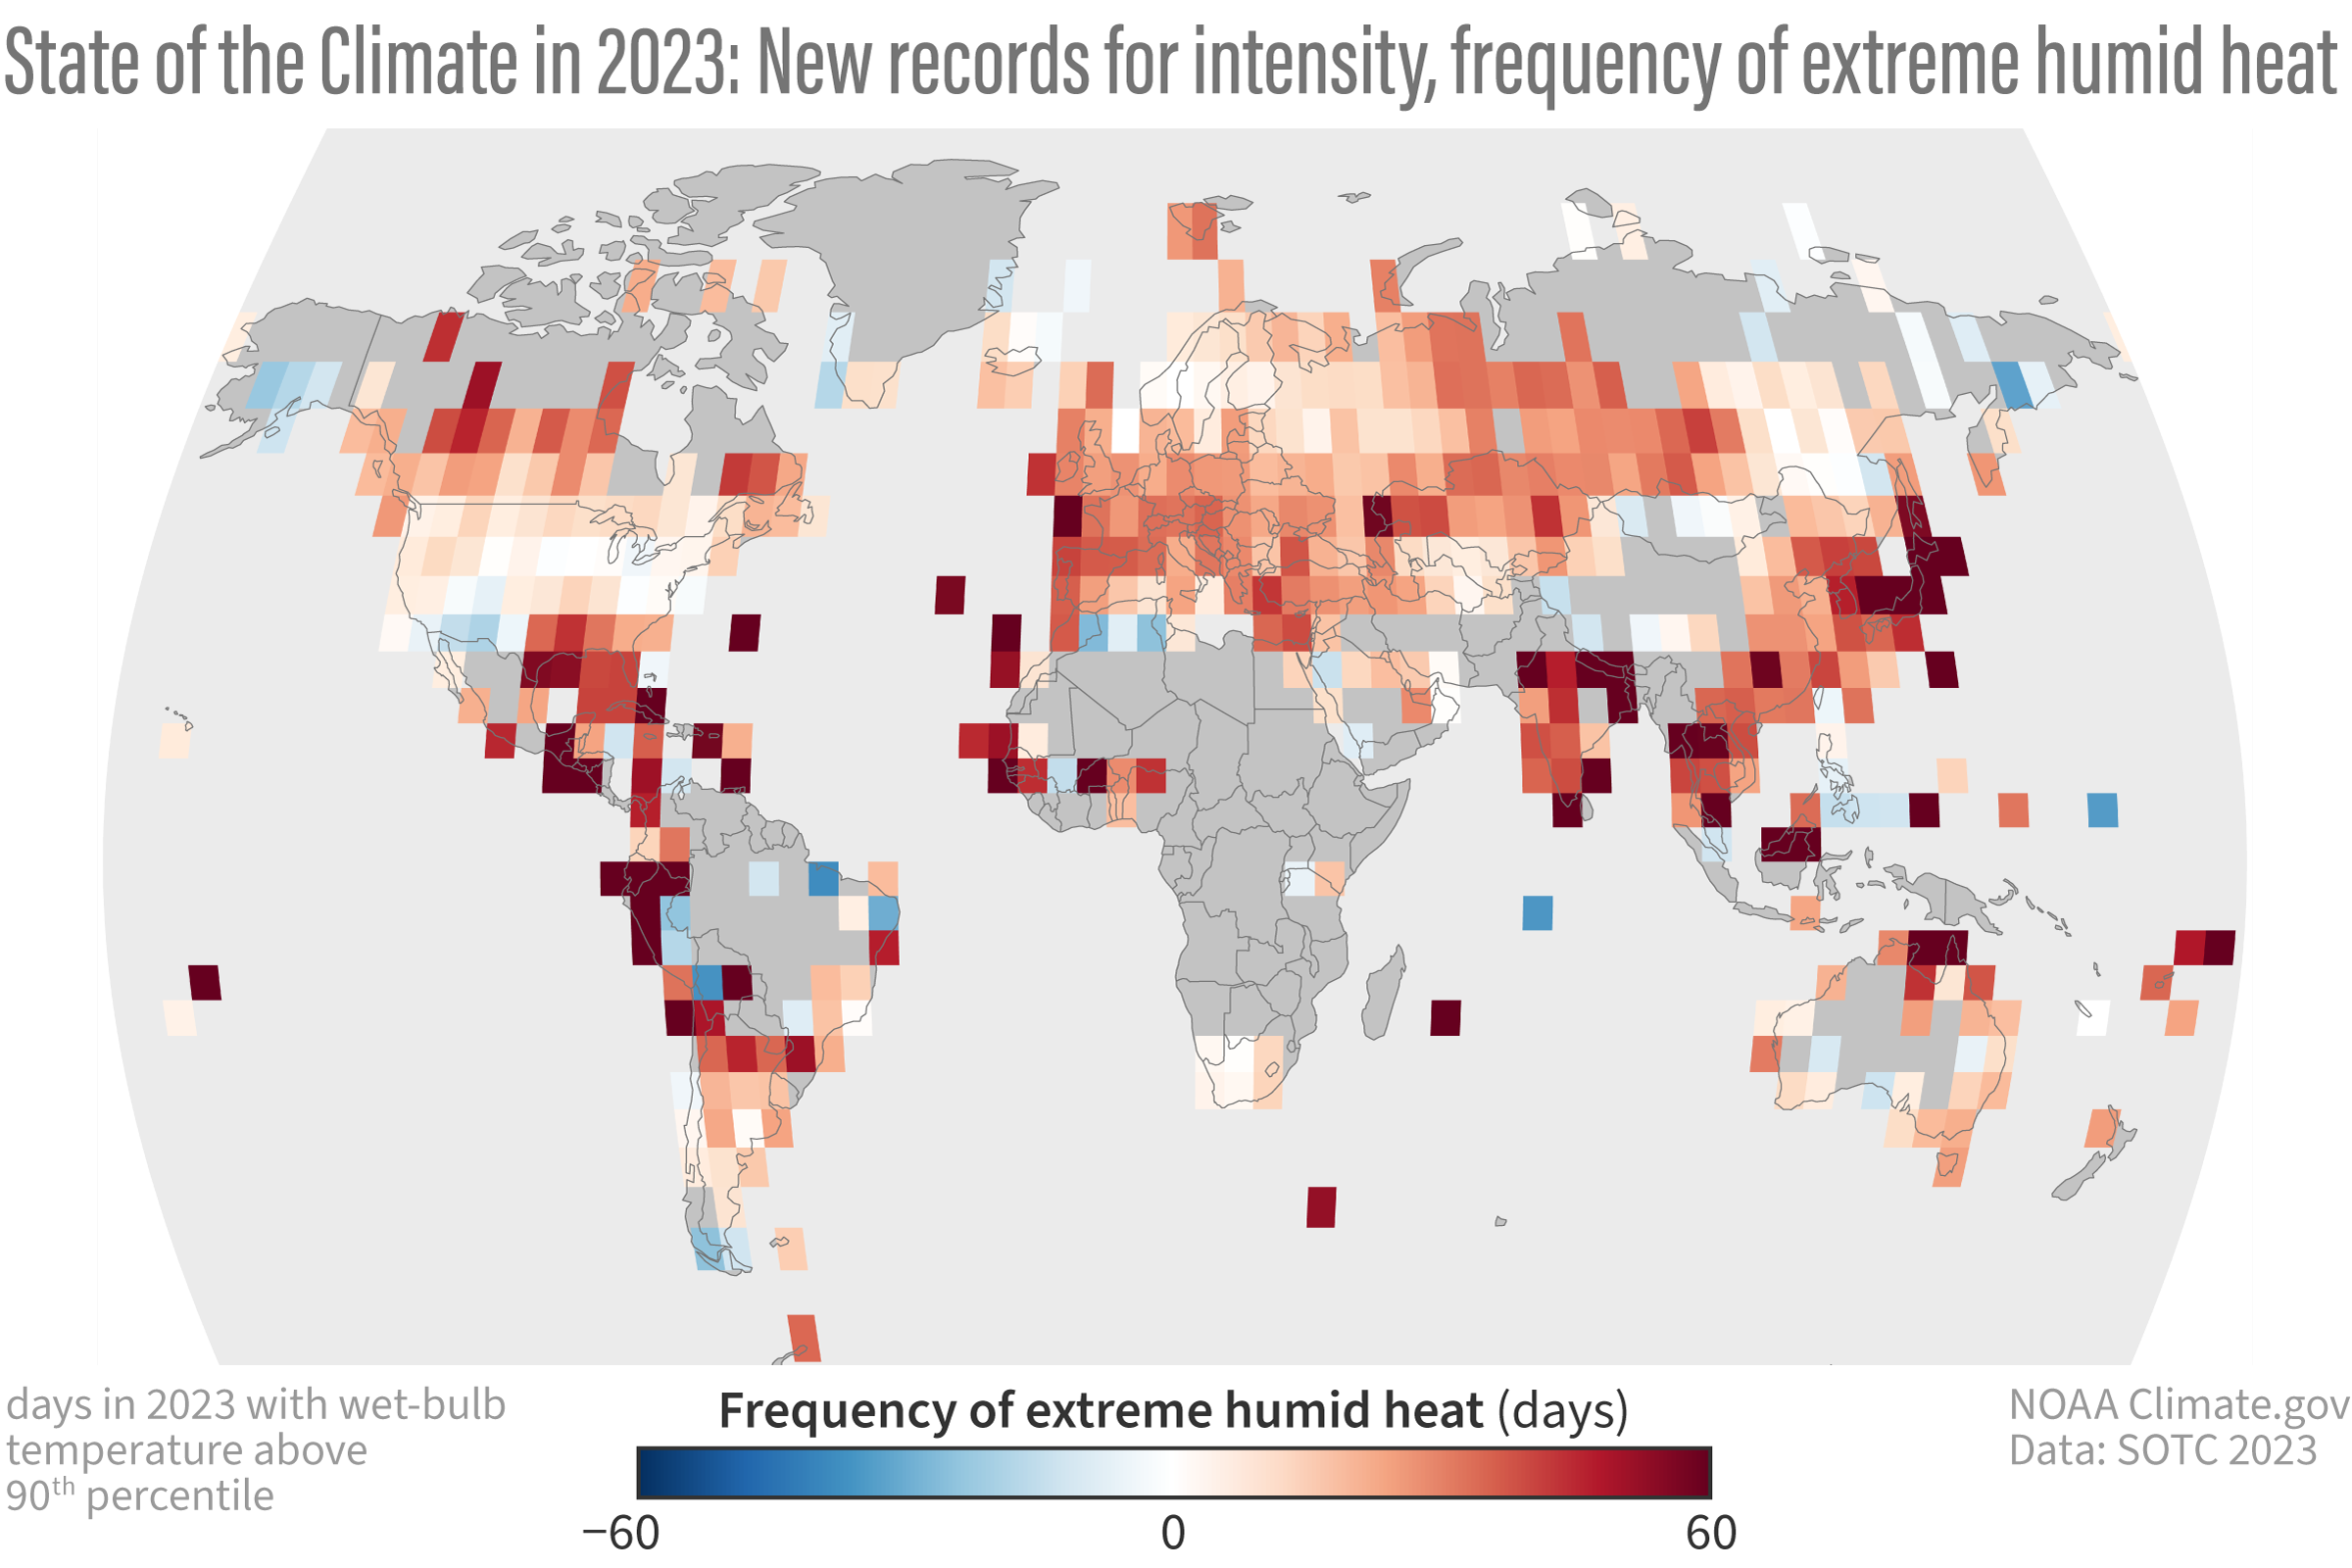
Image caption
This map shows the frequency of extreme humid heat worldwide in 2023 compared to the 1991-2023 average. Extreme humid heat is defined as a day when the maximum wet-bulb temperature is in the highest 10 percent on record from 1991-2020. The map compares the frequency of these days in 2023 to their normal frequency at that location from 1991-2020. Places that are darkest red experienced 60 or more days of extreme humid heat—2 months—more than average. Places where the frequency of extreme humid heat was less than average are colored blue. NOAA Climate.gov image, adapted from State of the Climate in 2023, Plate 2.1(i).