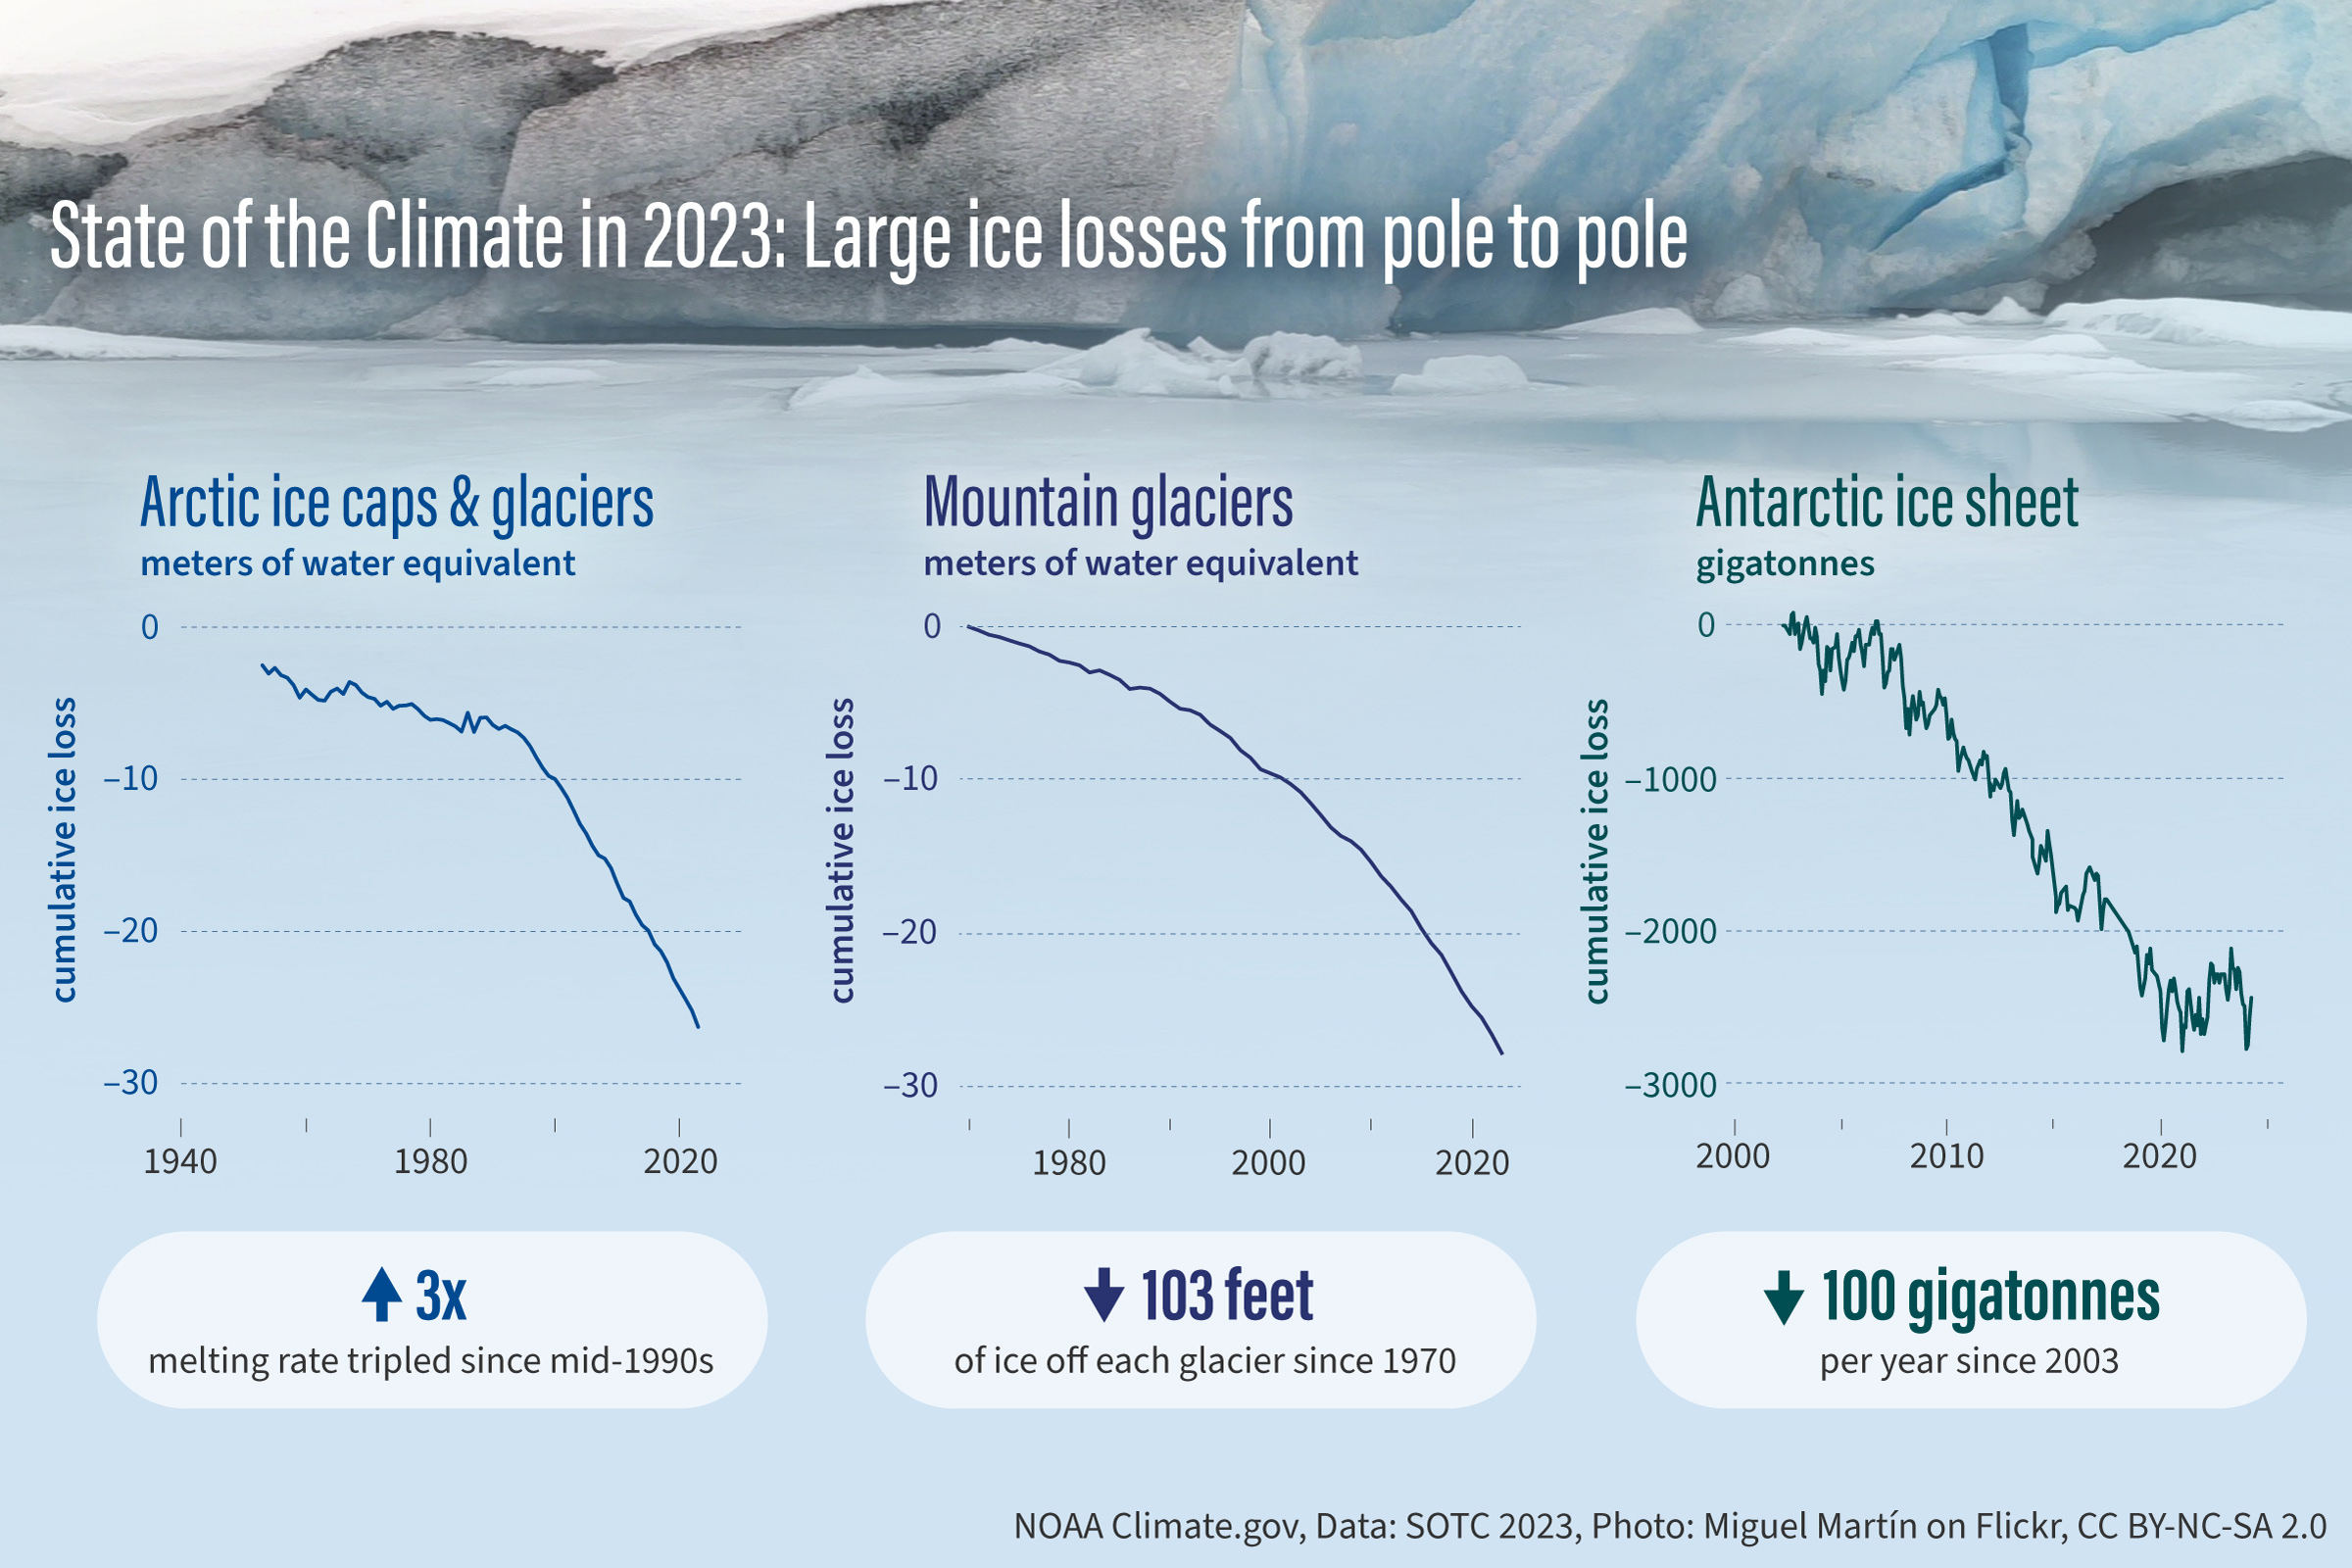
Image caption
This trio of line graphs shows ice loss over time from three different environments: (left) Arctic glaciers and ice caps (outside of Greenland), (center) mountain glaciers worldwide, and (right) the Antarctic Ice Sheet. From pole to pole and everywhere in between, Earth's ice is disappearing. NOAA Climate.gov image, adapted from Figures 5.22, 2.17, and 6.10a in State of the Climate in 2023. Photo by Miguel Martín, used under a Creative Commons license.