Image caption
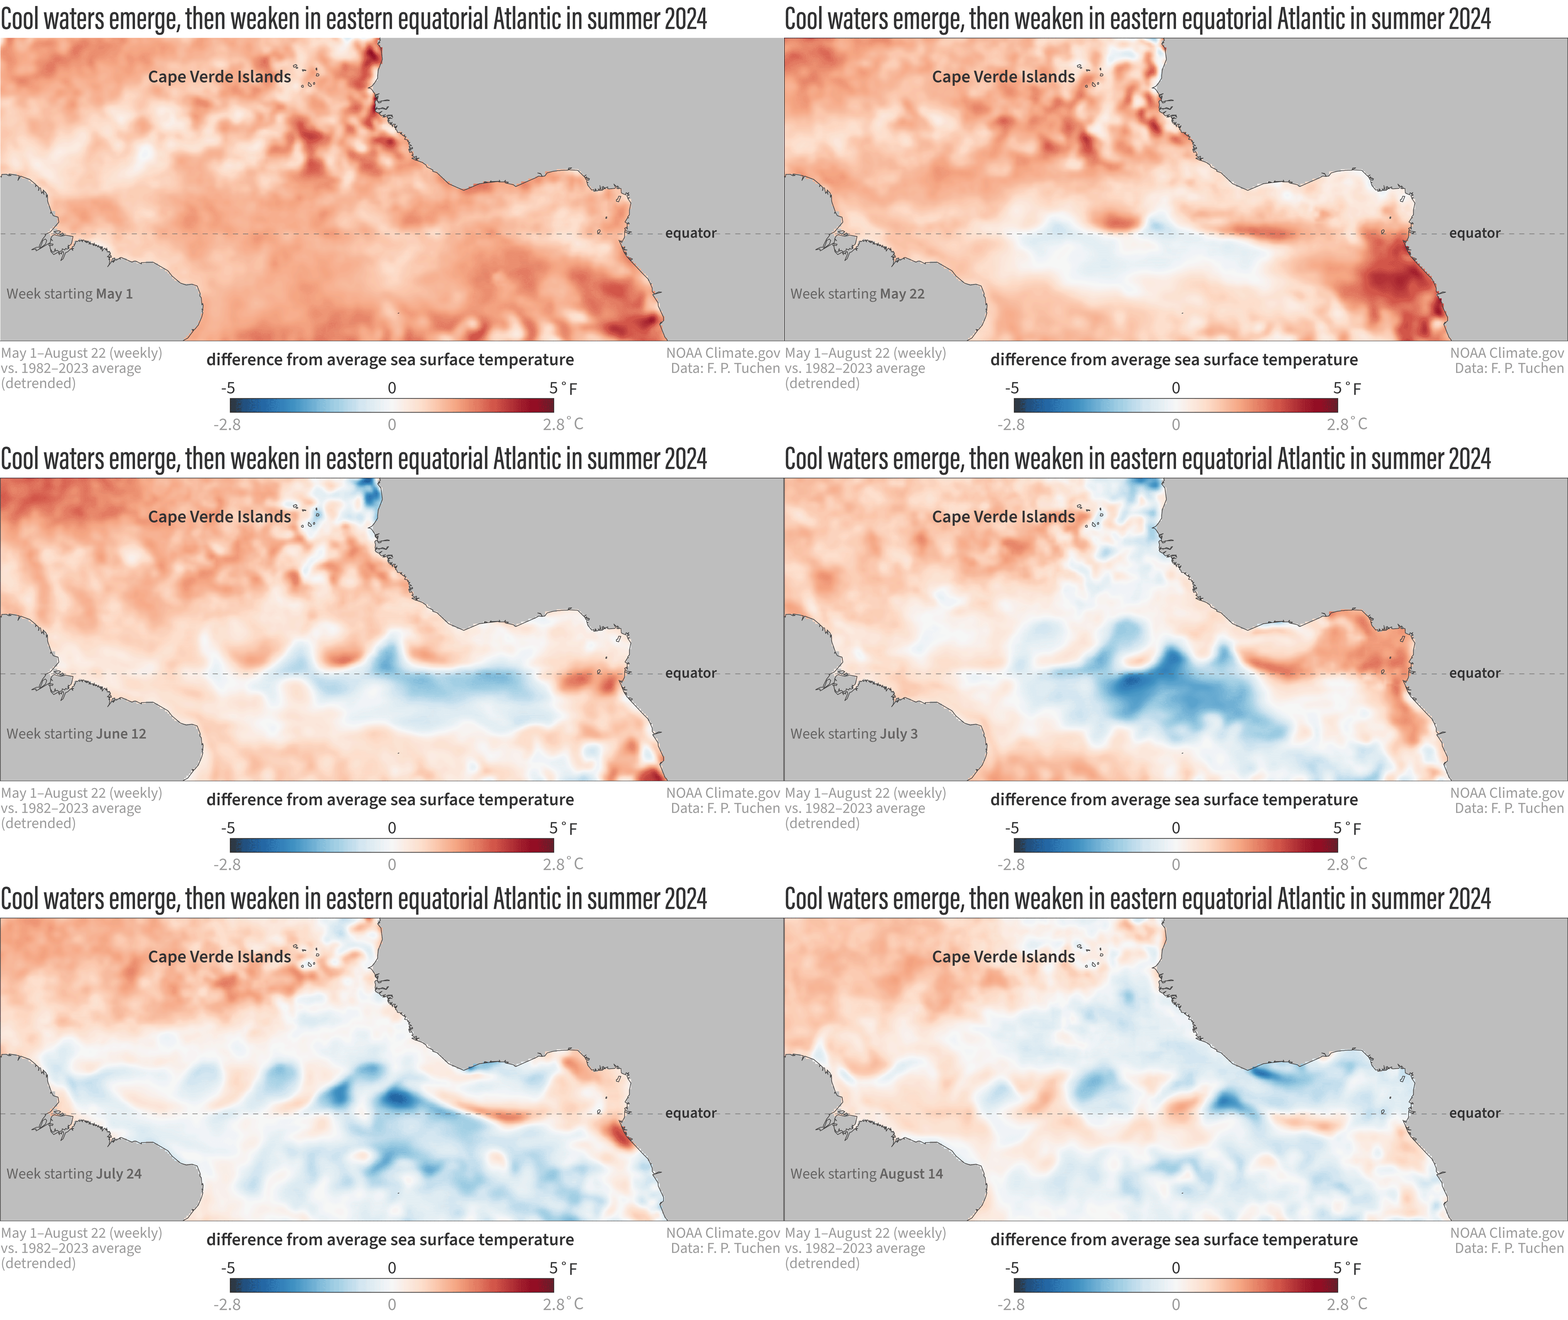
Weekly maps of sea surface temperatures in the tropical Atlantic Ocean from May 1–August 22, 2024, compared to the 1981–2023 average. The relatively cool conditions in the eastern part of the equatorial Atlantic in June and July have weakened somewhat through August, making the possibility of an Atlantic Niña less likely. The maps have been de-trended, meaning the influence of global warming on the ocean temperatures in this area have been subtracted out. This technique gives us a better picture of how current conditions compare to the new, warmer normal of today. Without de-trending, the warm areas on these maps would look even warmer, and the cool areas would look less cool. NOAA Climate.gov animation, based on analysis of NOAA OISST data by Franz Philip Tuchen.