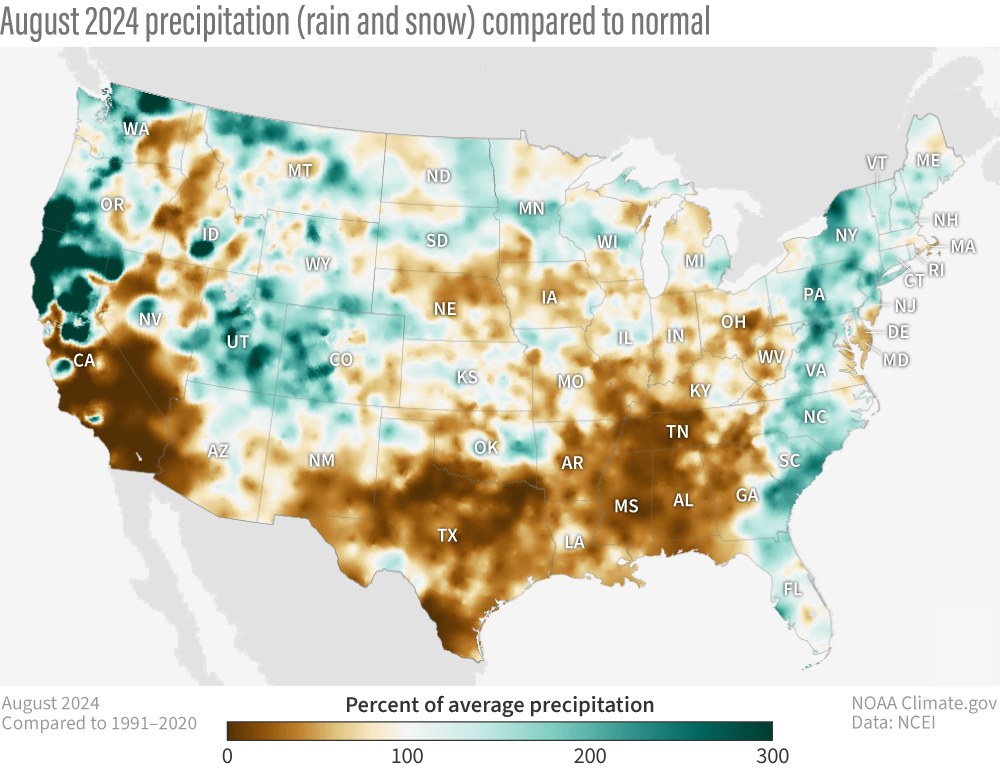
Image caption
This map shows August 2024 precipitation (total rain and snow) received across the United States as percent of normal (1991-2020 average). Places where precipitation was below normal are brown; places where it was above normal are blue-green. NOAA Climate.gov maps from our Data Snapshots: Precipitation collection, based on data from NCEI. Visit NCEI for climate statistics for Alaska and Hawaii.