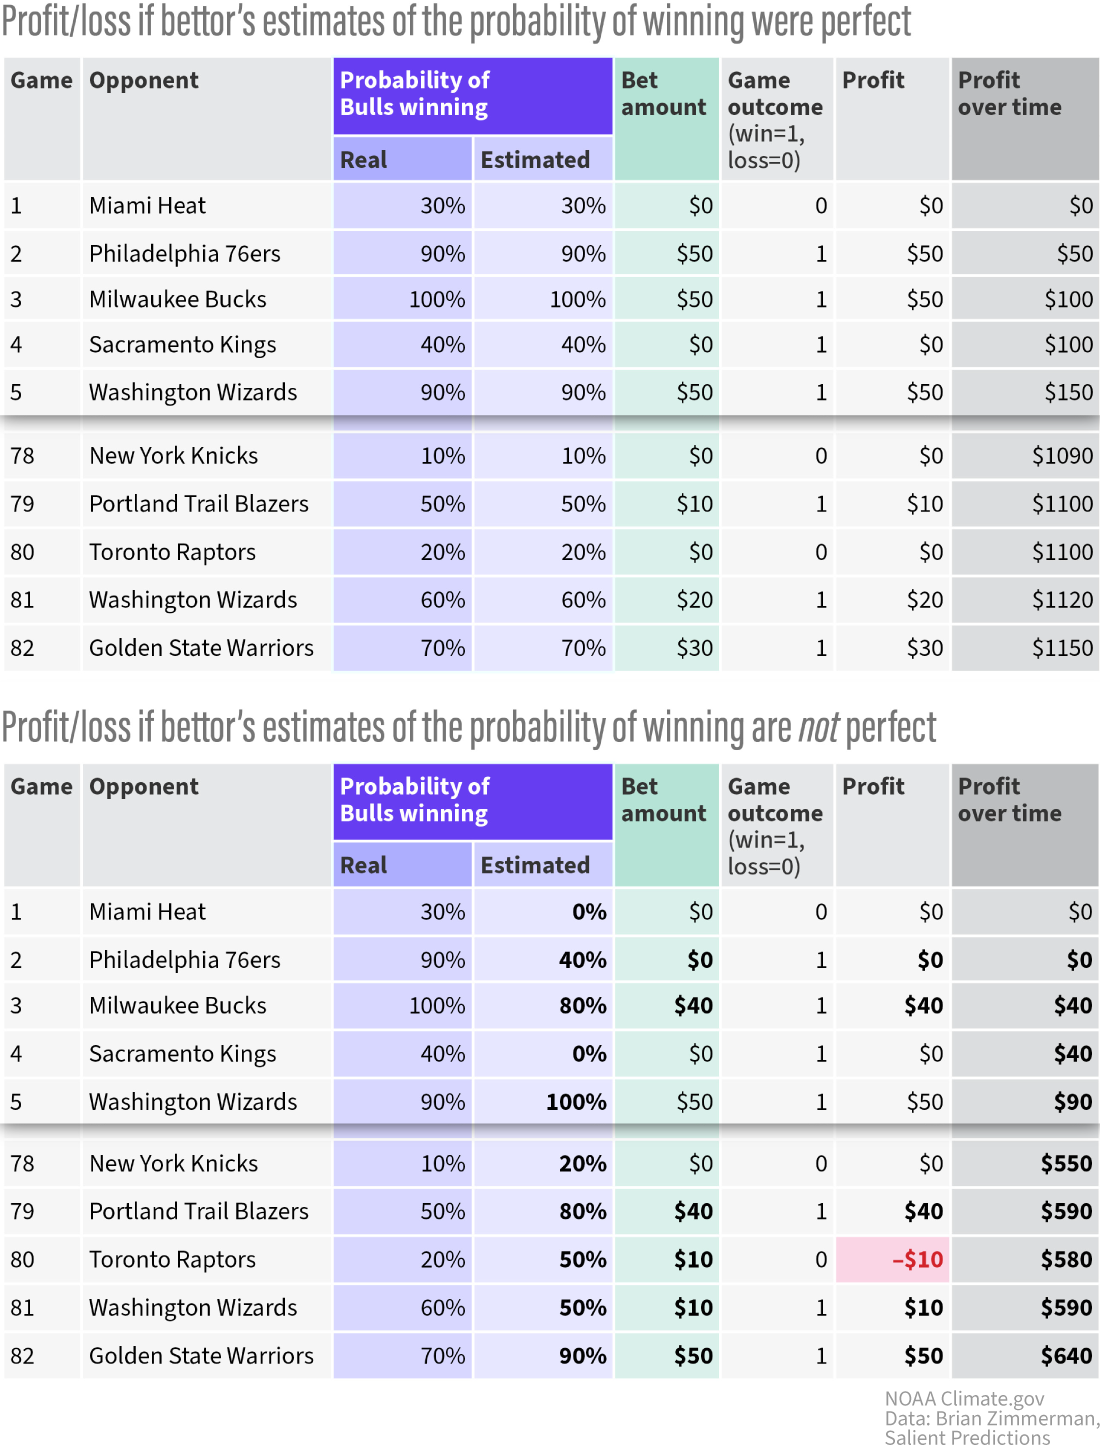
Image caption
(top) A simulated season in Experiment 2, where if you predict the Bulls have a 90 percent chance of winning a game against the 76ers, they do, in fact, win against them 90% of the time (line 2). (bottom) A season from Experiment 3, where your estimates of the chances are good, but not perfect. You estimate the Bulls have a 60% percent chance of beating the Wizards over time, but they only beat them 50 % of the time (Line 81). NOAA Climate.gov graphic, based on data from Brian Zimmerman.