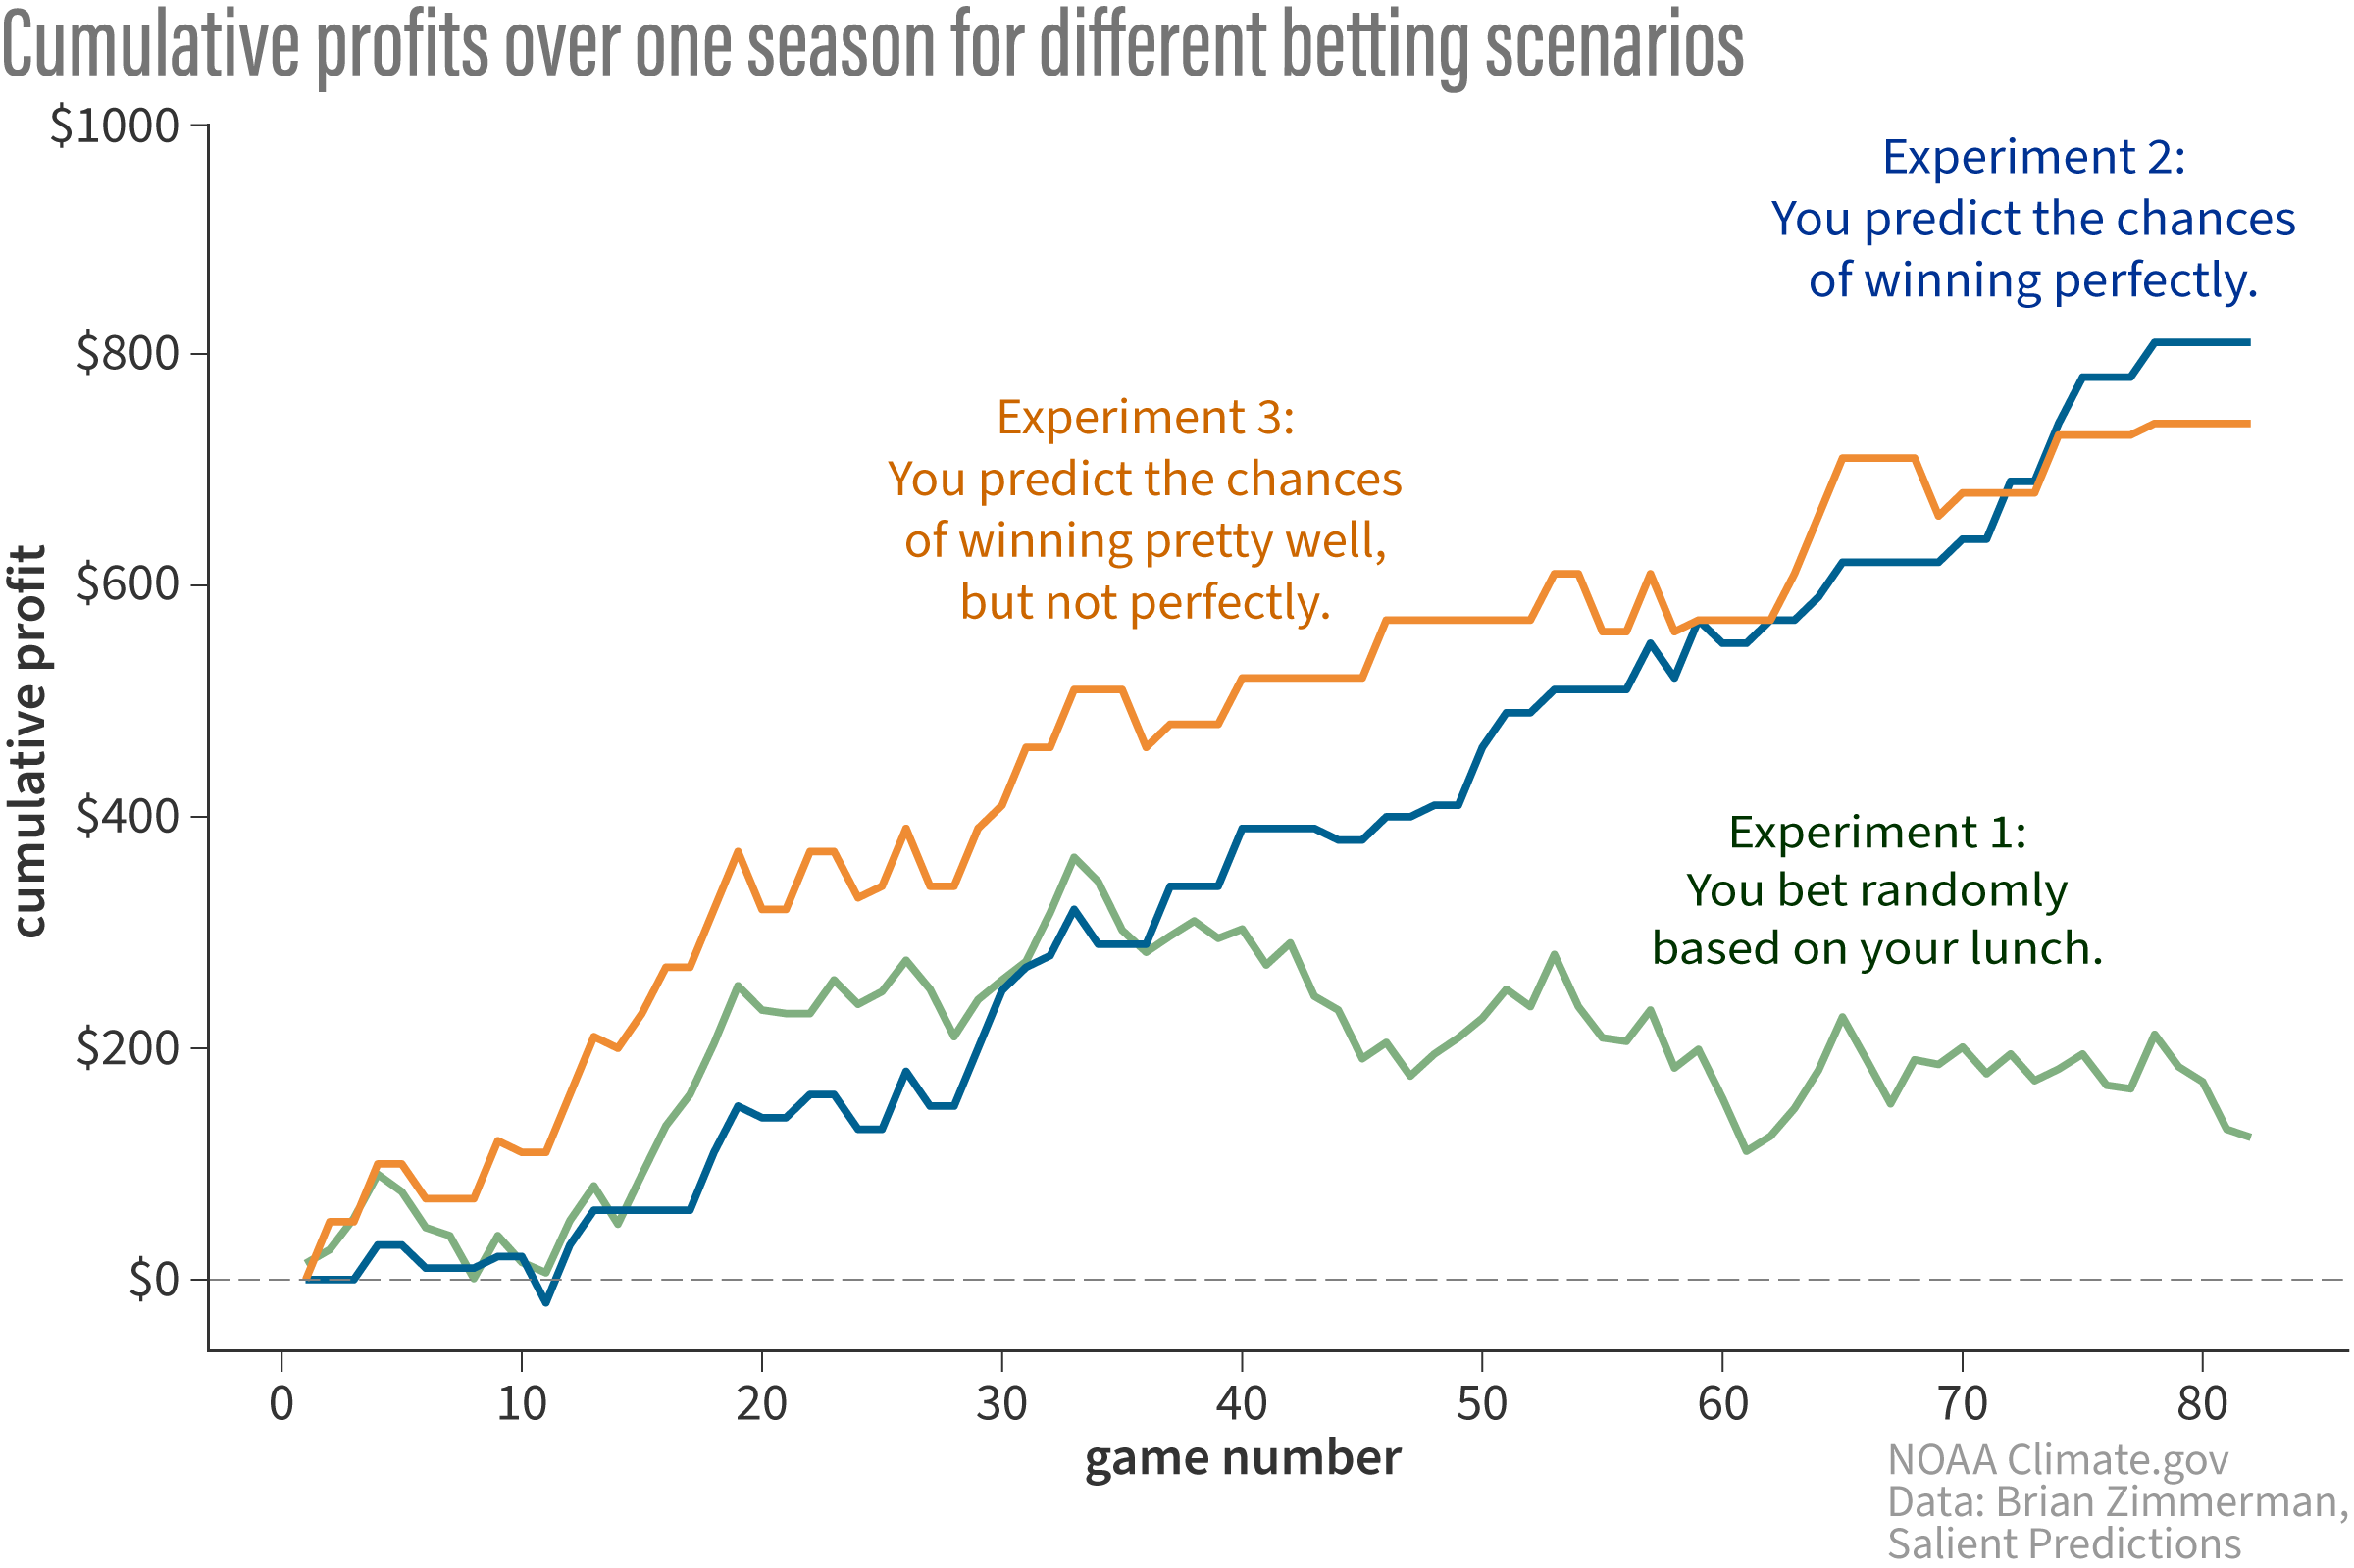
Image caption
Game by game cumulative profits for season 796 from each of the three experiments. In this season of the experiments, the bettor scenario using a decision support system with true probabilities (blue) did worse than the other two strategies until the very end of the 82-game season! NOAA Climate.gov image, adapted from original by Brain Zimmerman.