Image caption
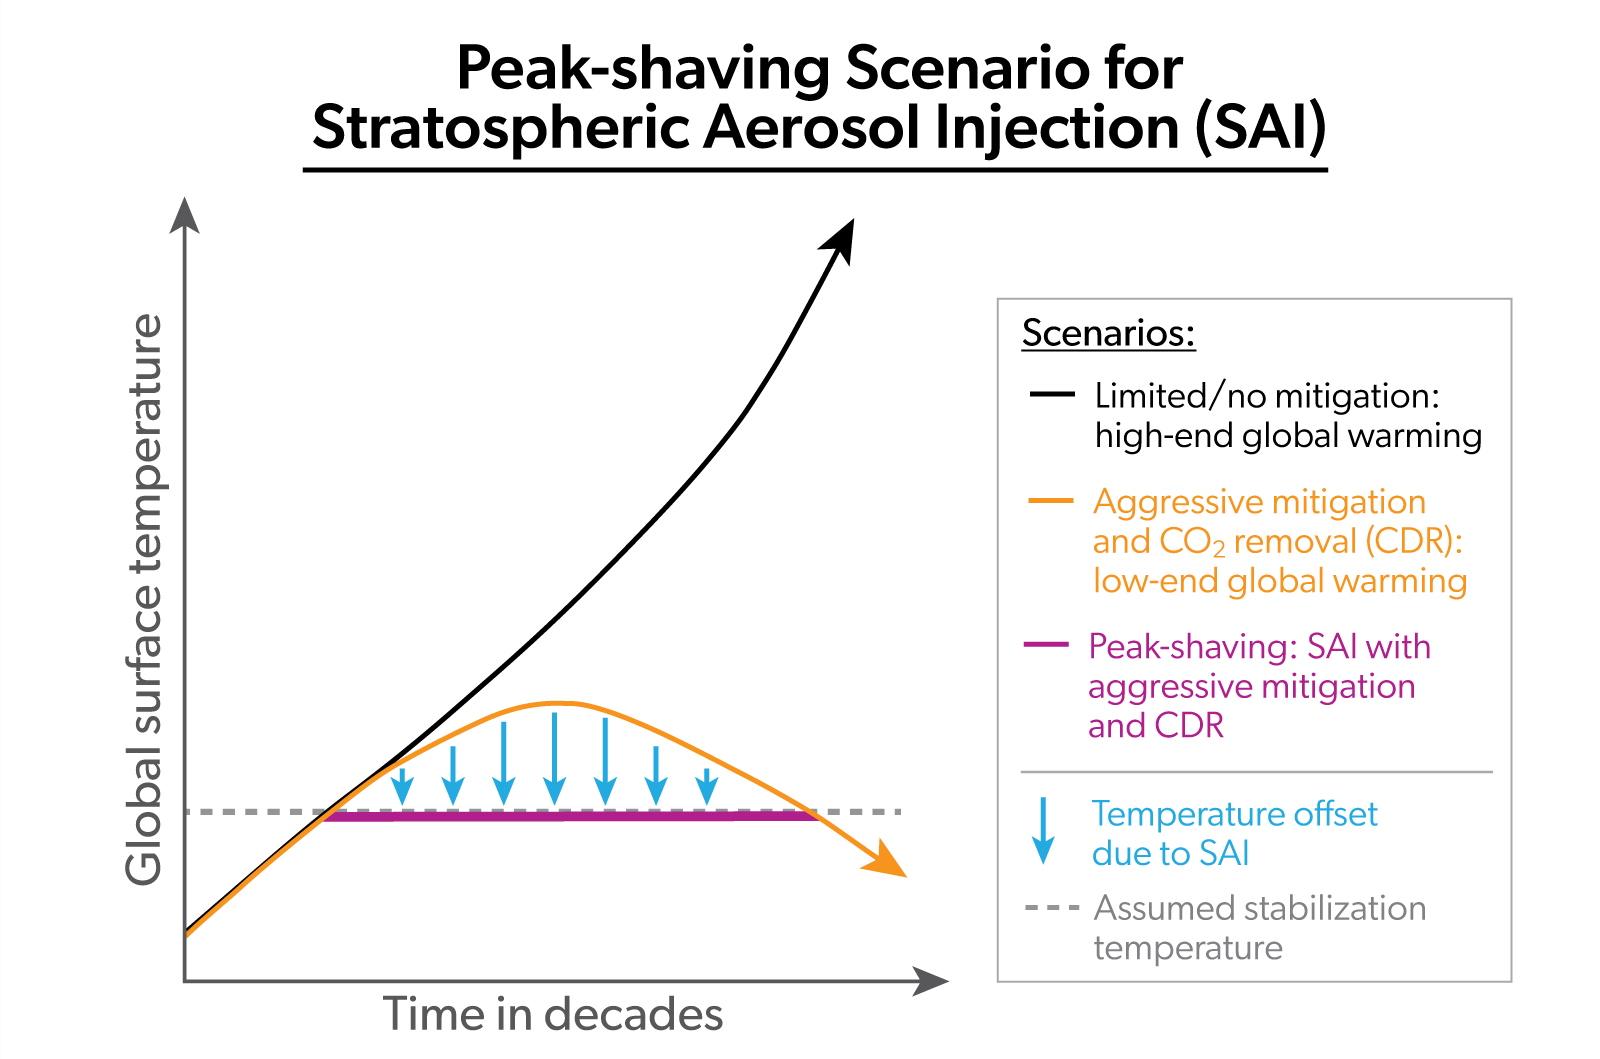
Figure 2. Schematic diagram representing the concept of peak-shaving. Different lines illustrate the global mean temperatures for future scenarios. Blue arrows represent the relative magnitude of the temperature impact of stratospheric aerosol injection (SAI).