
Image caption
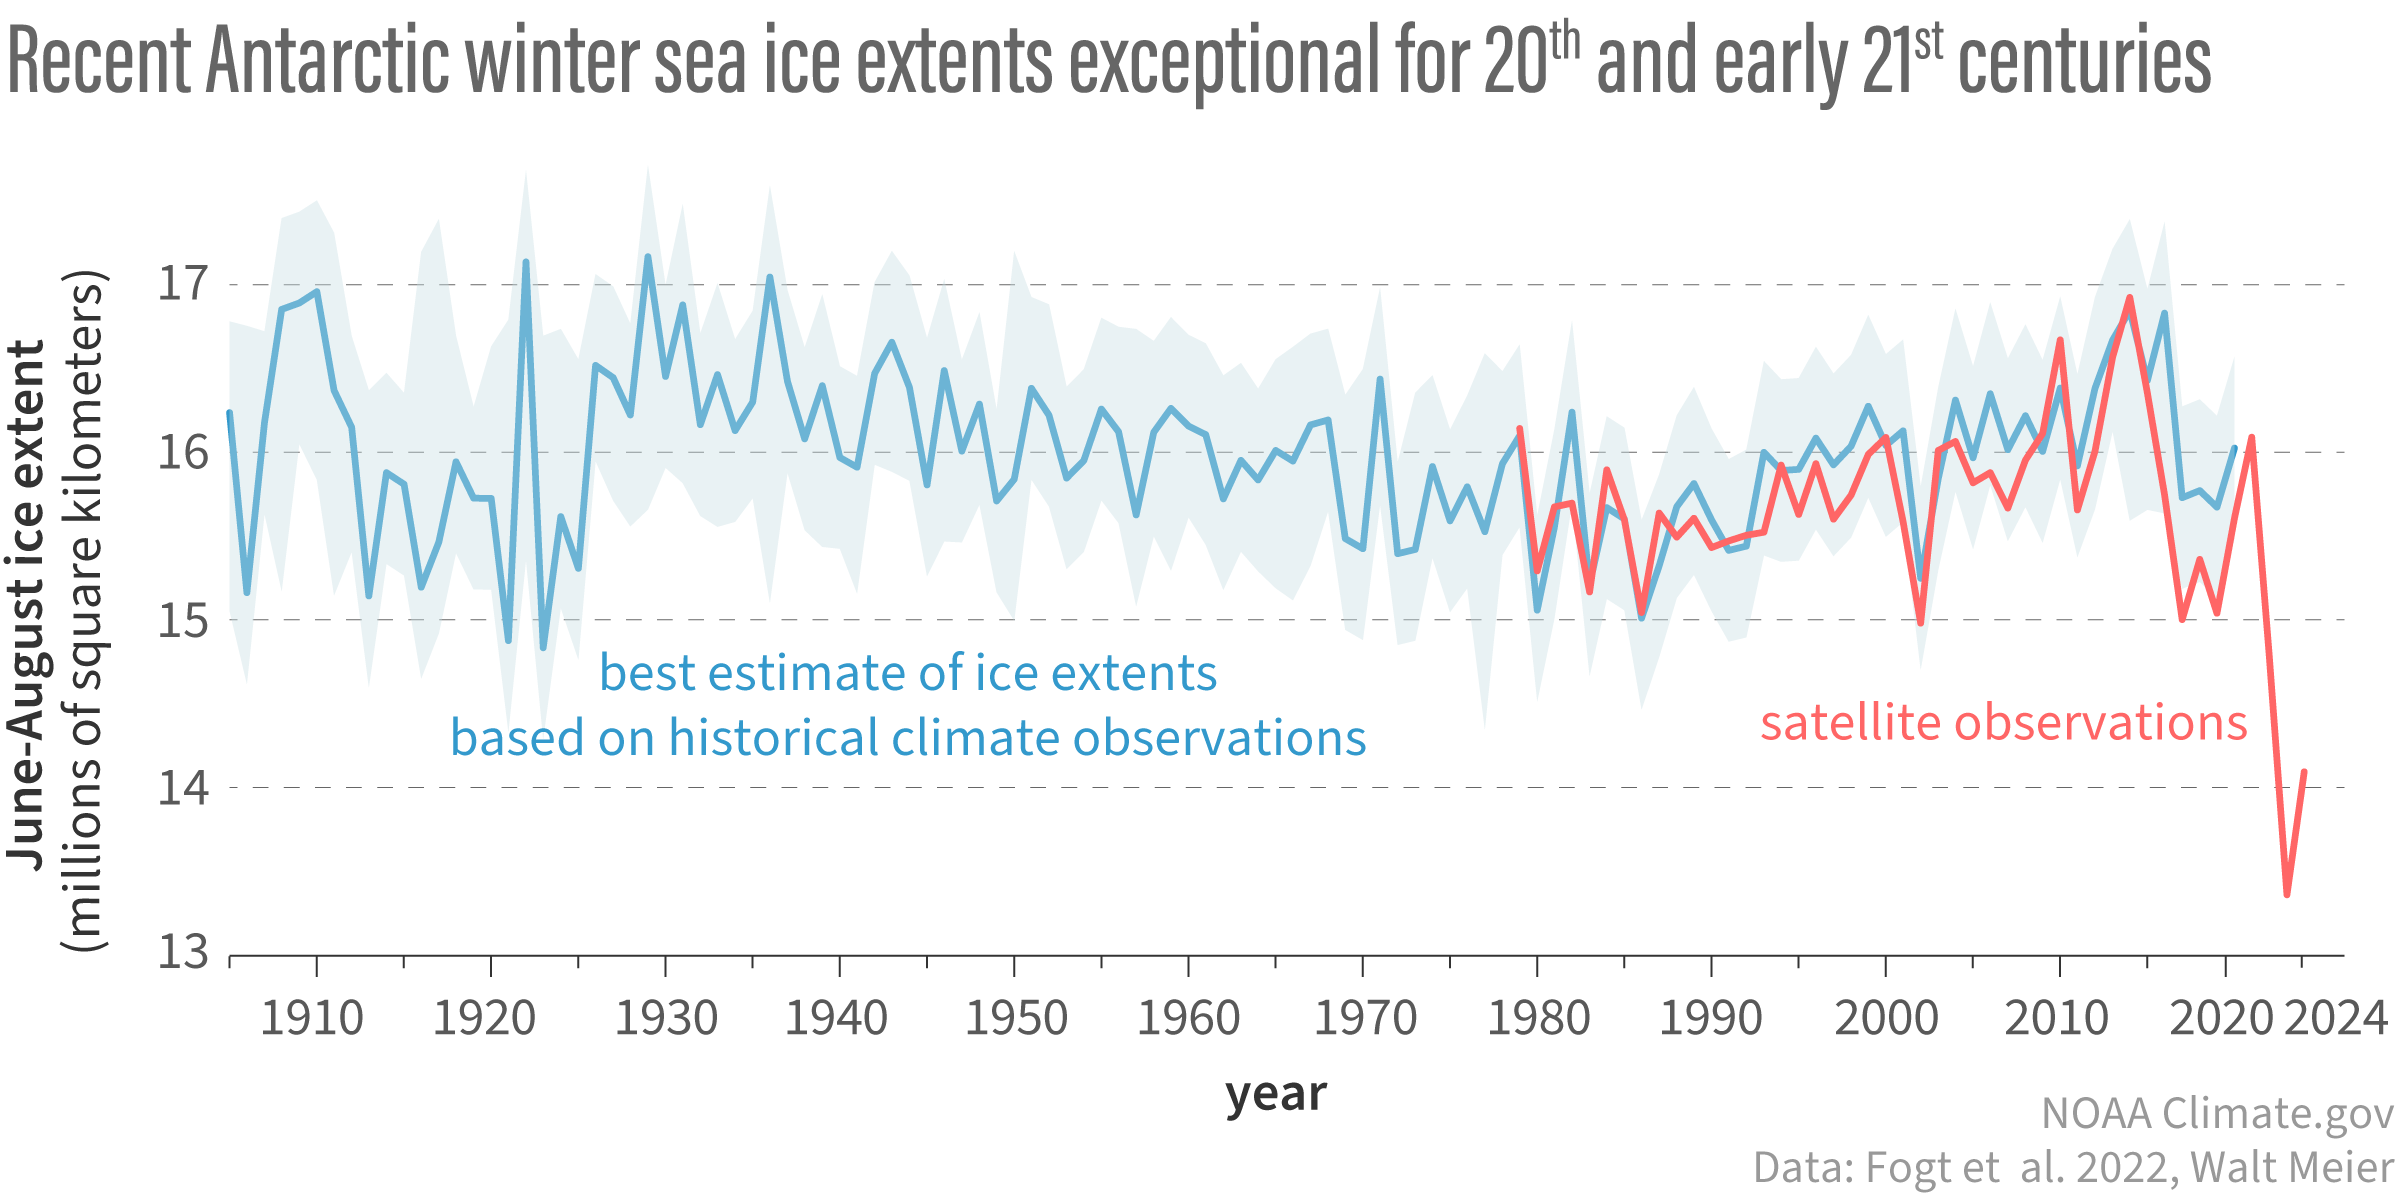
This graph shows average winter (June-August) Antarctic sea ice extent from the early 20th century through 2024. The blue line shows the best estimate (“best fit”) of ice extents reconstructed from historical climate data for the pre-satellite era. The light blue shading around that line shows the range of variability (upper and lower 95% bounds). The red line shows values from the modern satellite era, from NSIDC’s Sea Ice Index, 1979-2024. NOAA Climate.gov, adapted from original in NSIDC’s Sea IceToday report, based on data from Fogt et al. 2022 and Walter Meier, NSIDC.