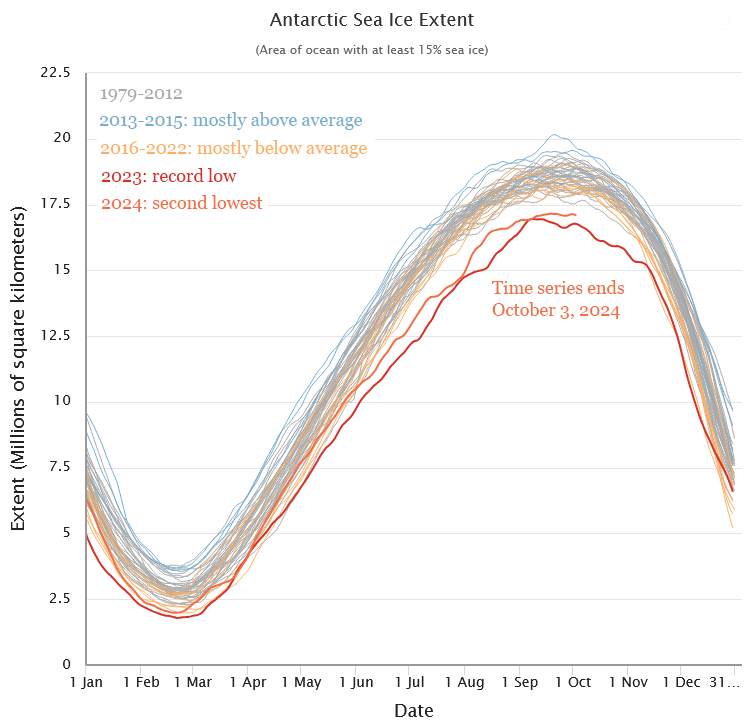
Image caption
This graph shows a time series of Antarctic sea ice extents, 1979-2024, derived from NSIDC’s Charctic interactive tool. The left axis shows square kilometers, and the bottom axis shows months of the year. Each year has its own extent line. Extent lines are color-coded: gray for 1970-2012, blue for 2013-2015 (mostly above-average extents), pale orange for 2016-2022 (mostly below-average extents), darkest red-orange for 2023 (record-low winter maximum extent), and dark orange for 2024 (second-lowest winter maximum extent). NOAA Climate.gov derived from NSIDC visualization