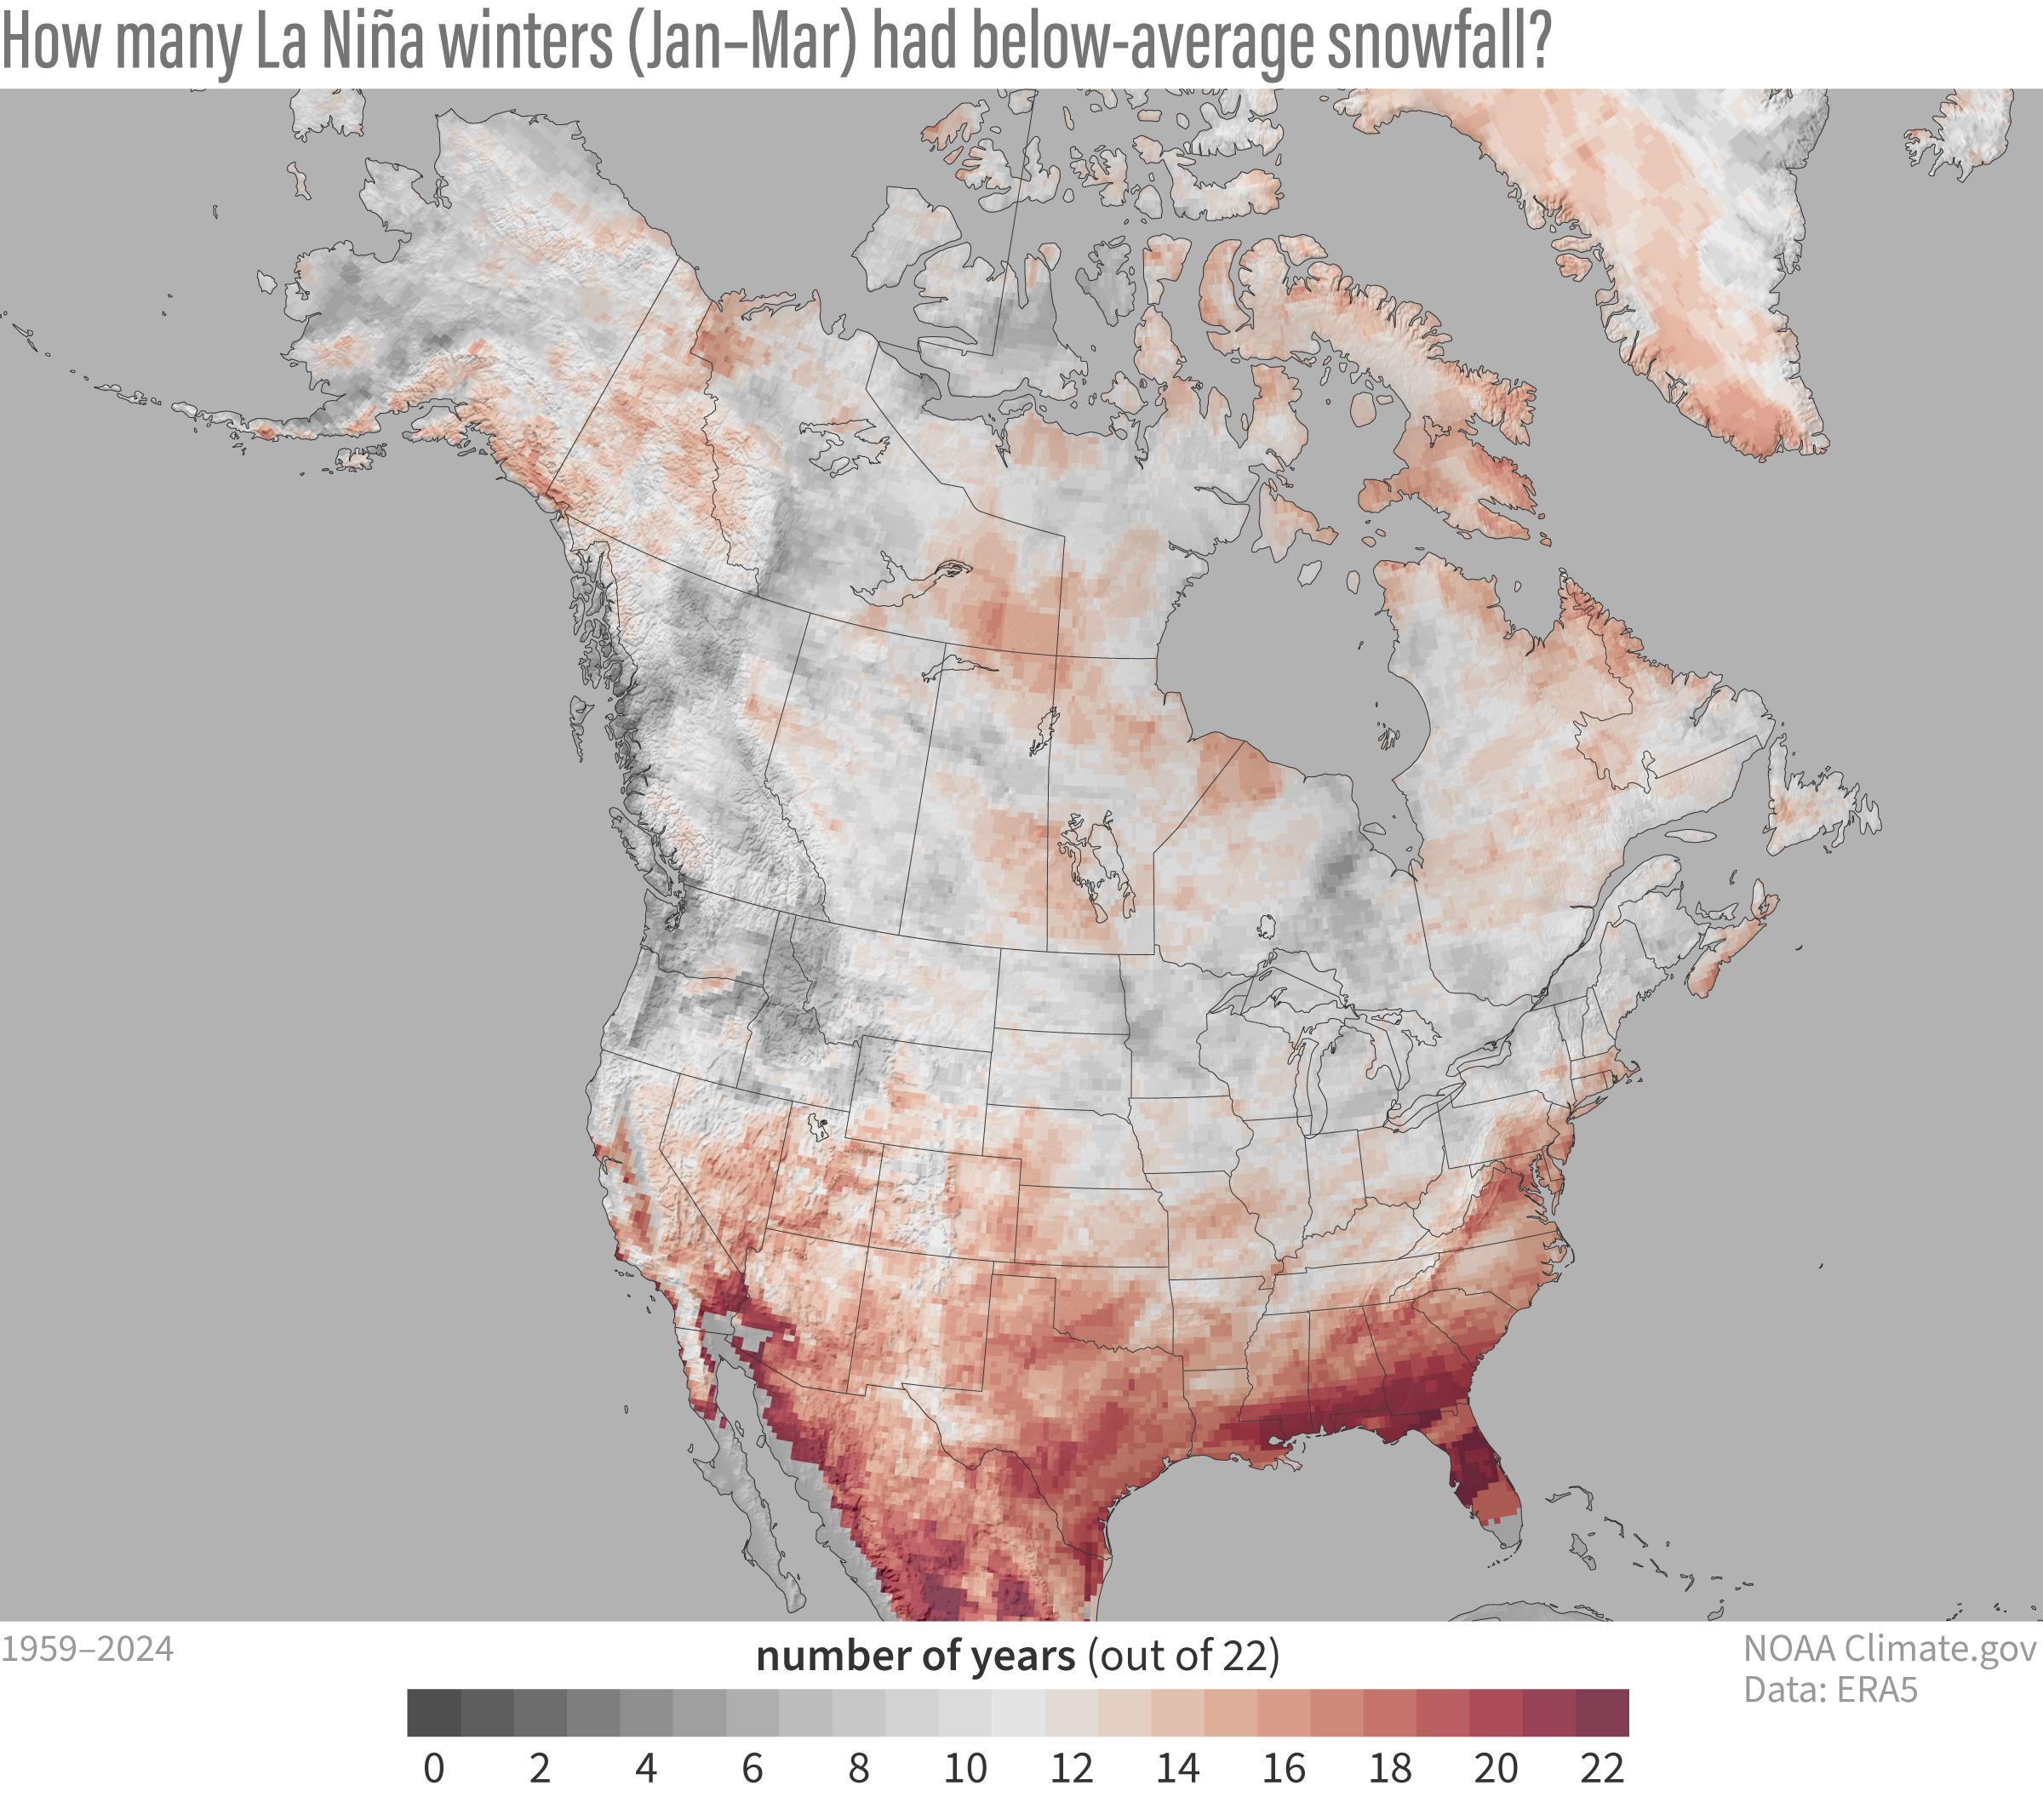
Image caption
This map shows how many of the 22 historical La Niña winters from 1959–2024 had below-average snowfall from January–March. Red colors mean those places had below-average snowfall more than half the time. Gray colors mean those places had below-average snowfall less than half the time. The long-term trend has been removed to better show the influence of La Niña on its own. NOAA Climate.gov map, based on ERA5 reanalysis data and analysis by Michelle L’Heureux.