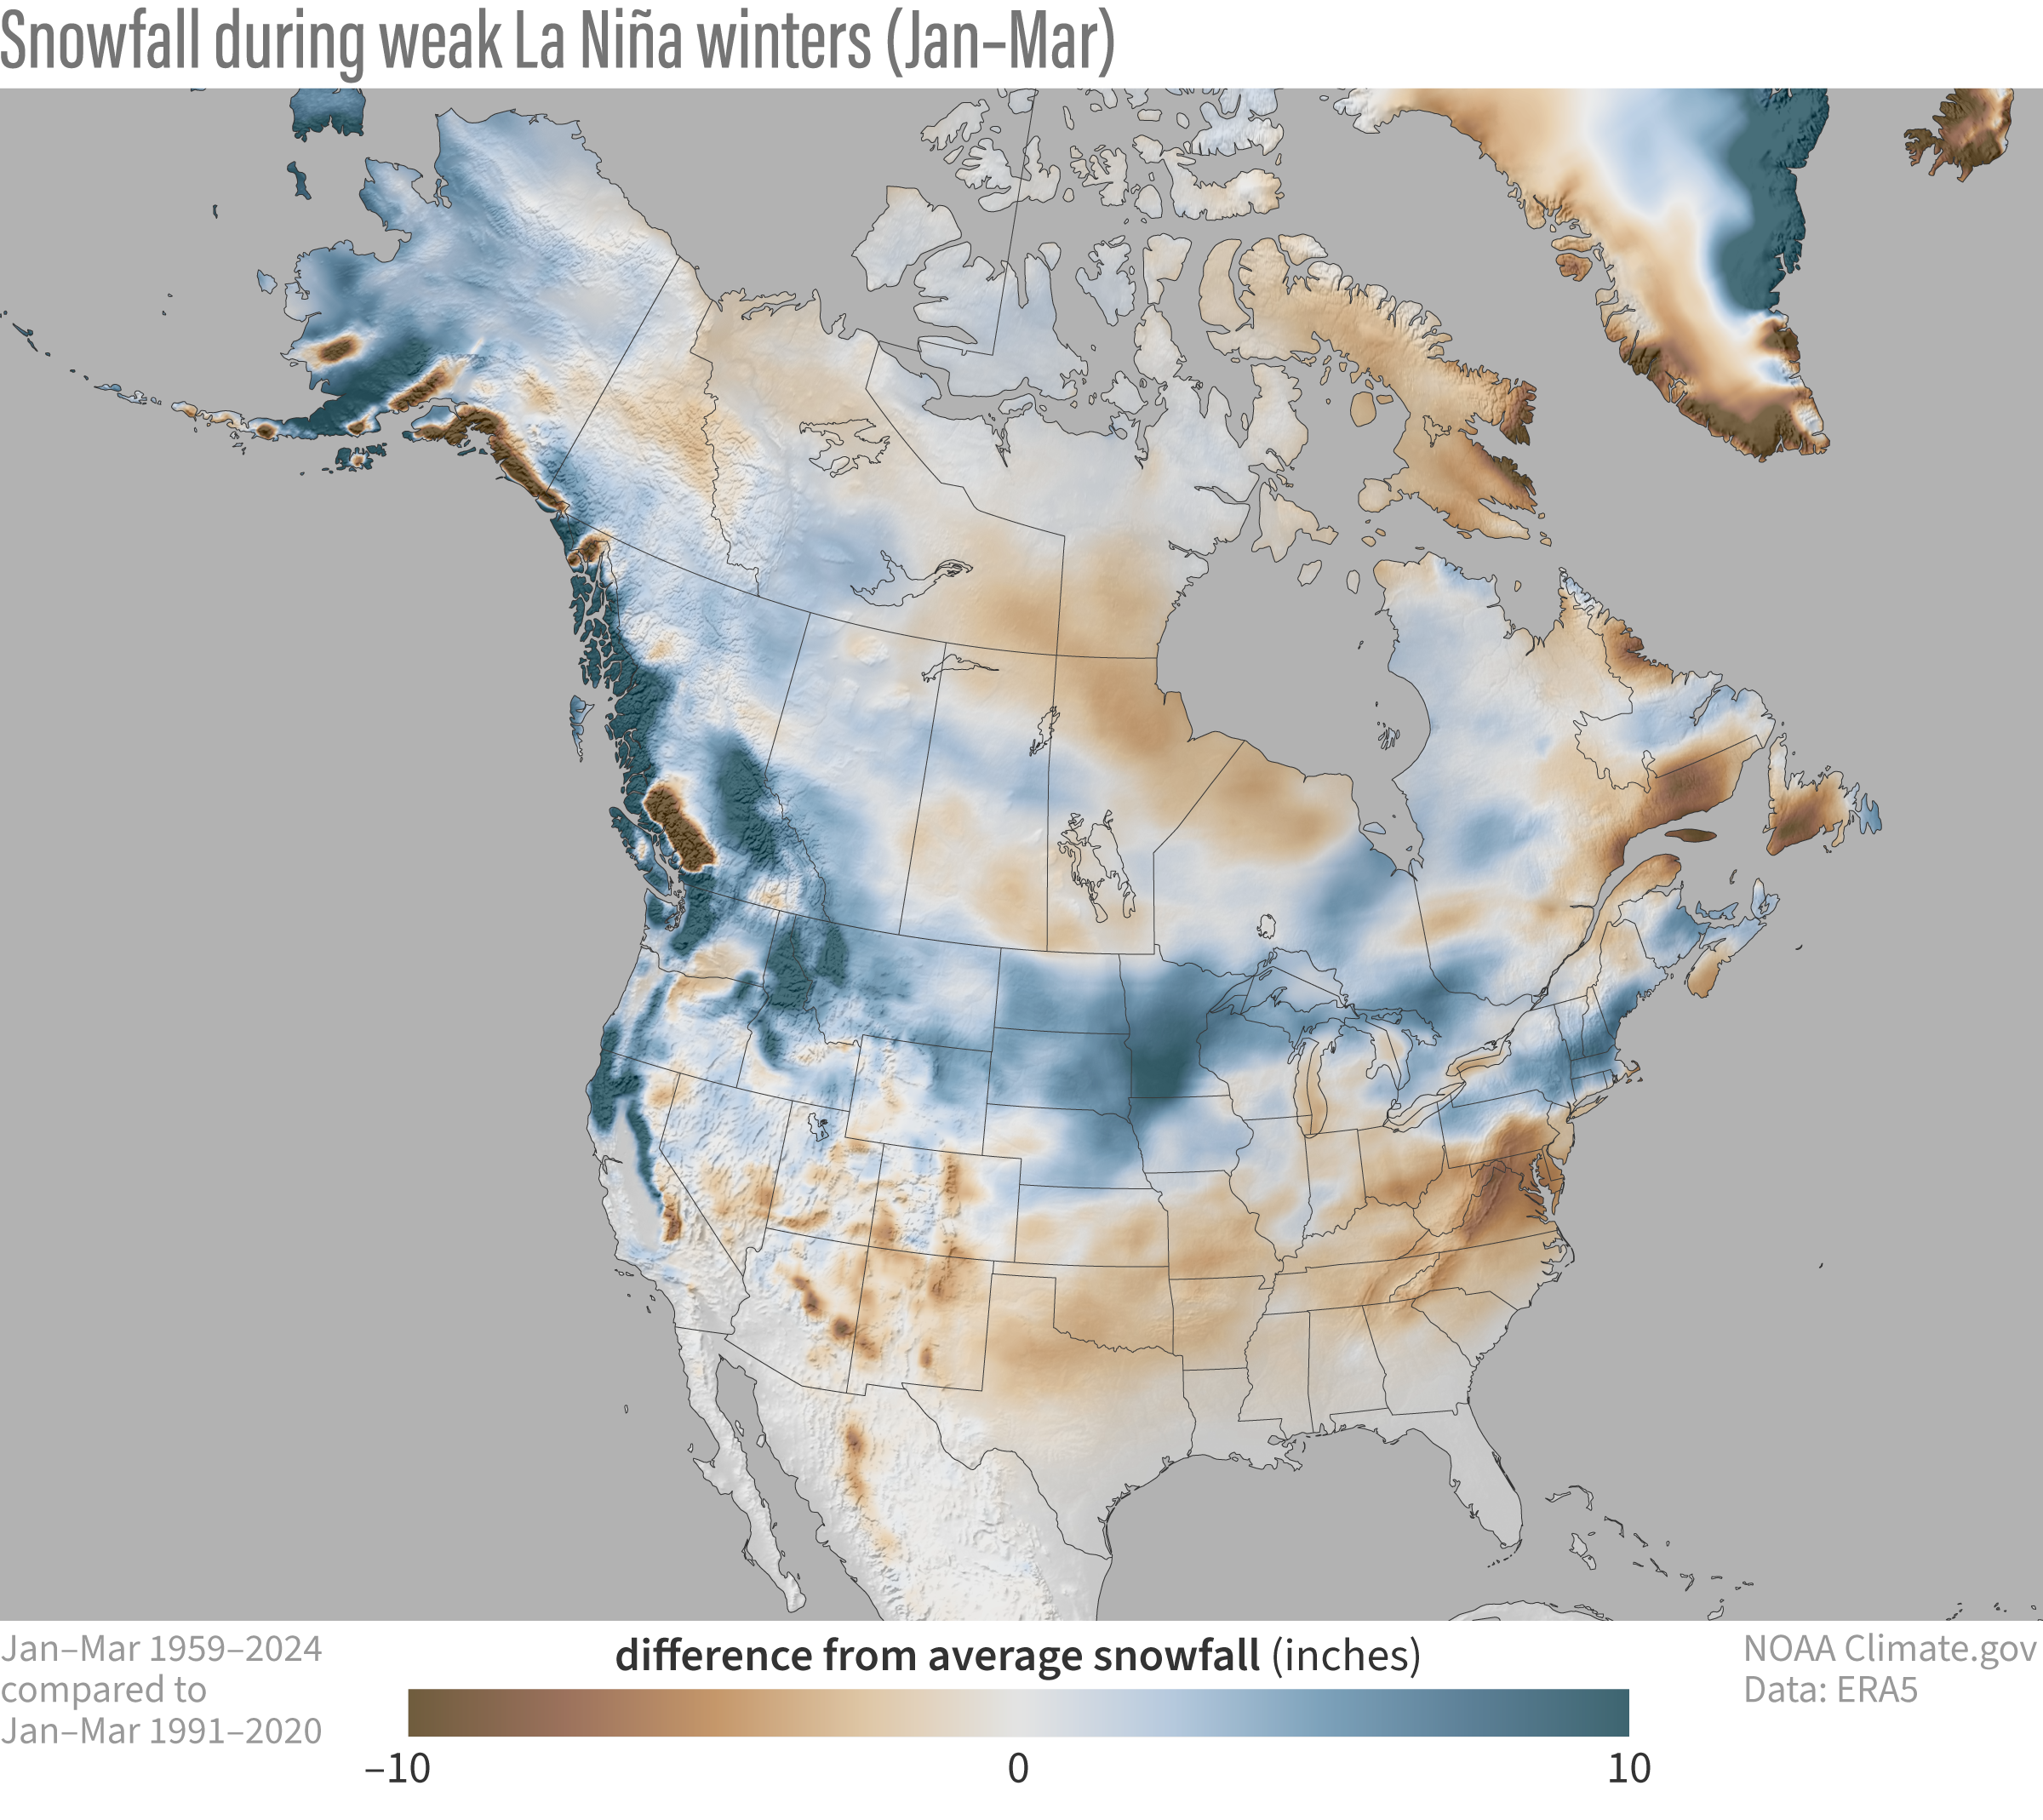
Image caption
January–March snowfall during 9 weak La Niña winters from 1959–2024 compared to the average for all January–March periods from 1991–2020. The long-term trend in snowfall over this period has been removed, meaning the maps better show the influence of weak La Niñas by themselves. NOAA Climate.gov map, based on ERA5 reanalysis data and analysis by Michelle L’Heureux.