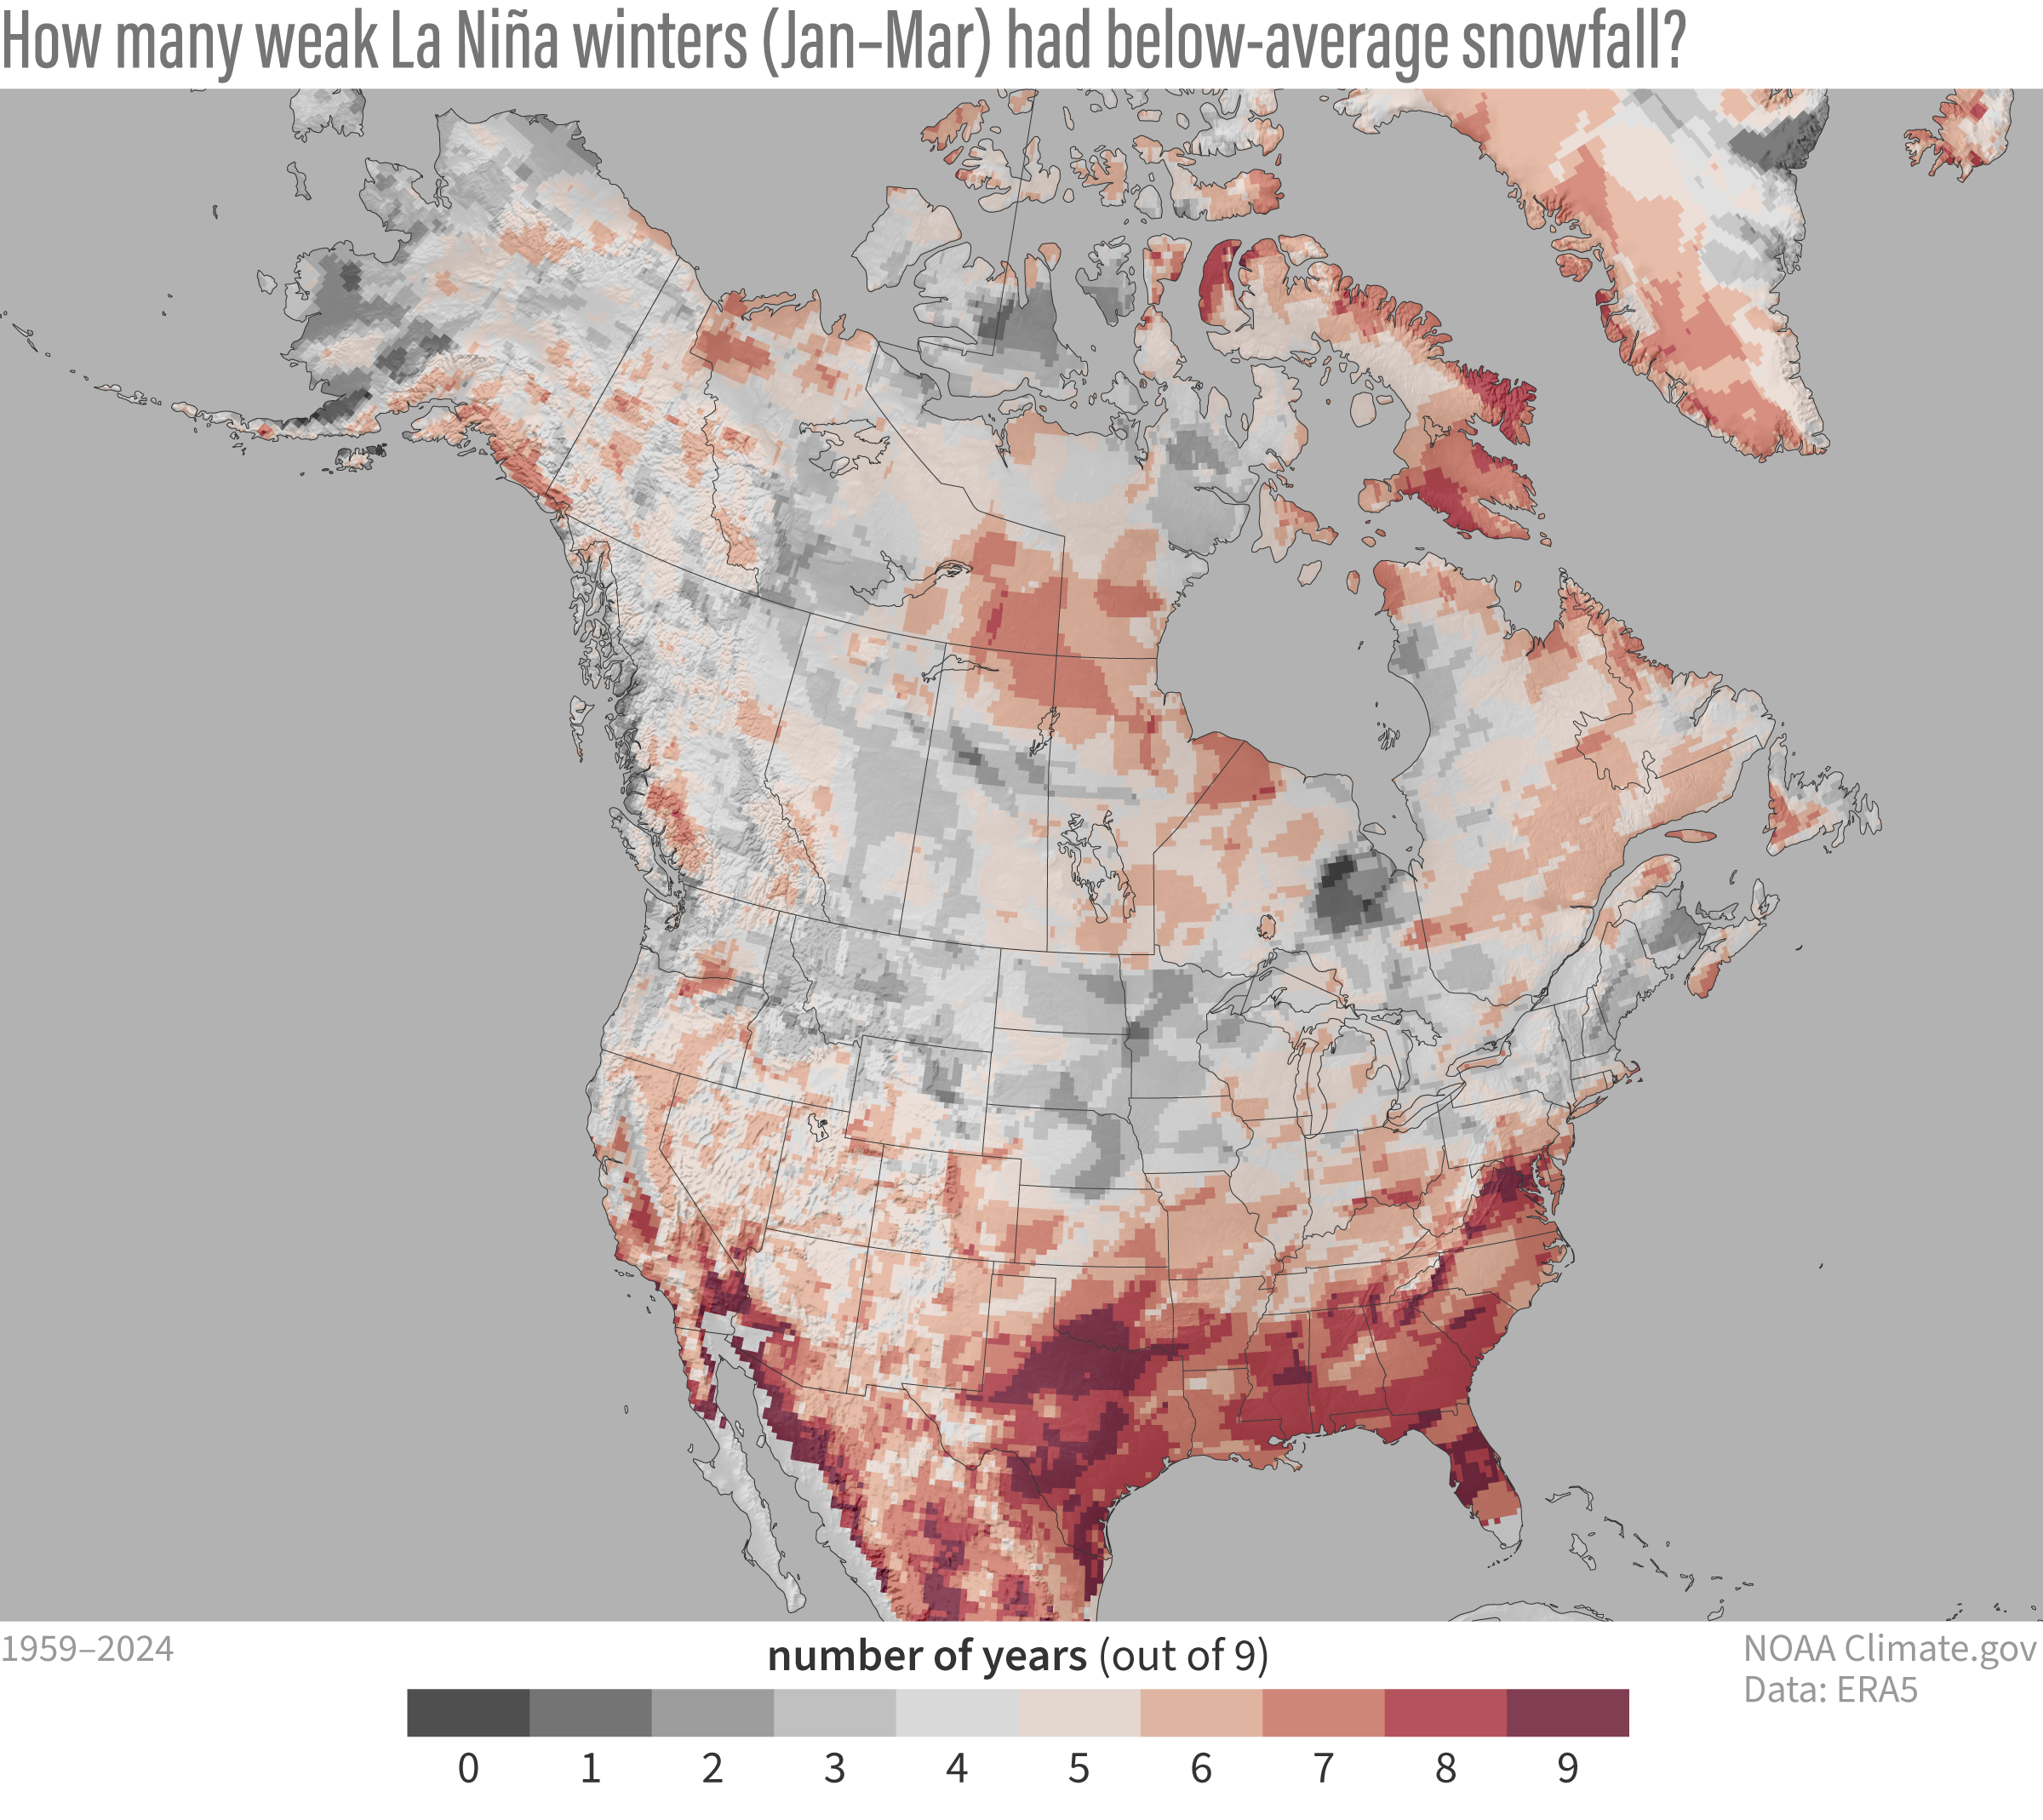
Image caption
This map shows how many of the 9 historical weak La Niña winters from 1959–2024 had below-average snowfall from January–March. Red colors mean those places had below-average snowfall more than half the time. Gray colors mean those places had below-average snowfall less than half the time. The long-term trend in snowfall over this period has been removed to better show the influence of weak La Niñas by themselves. NOAA Climate.gov map, based on ERA5 reanalysis data and analysis by Michelle L’Heureux.