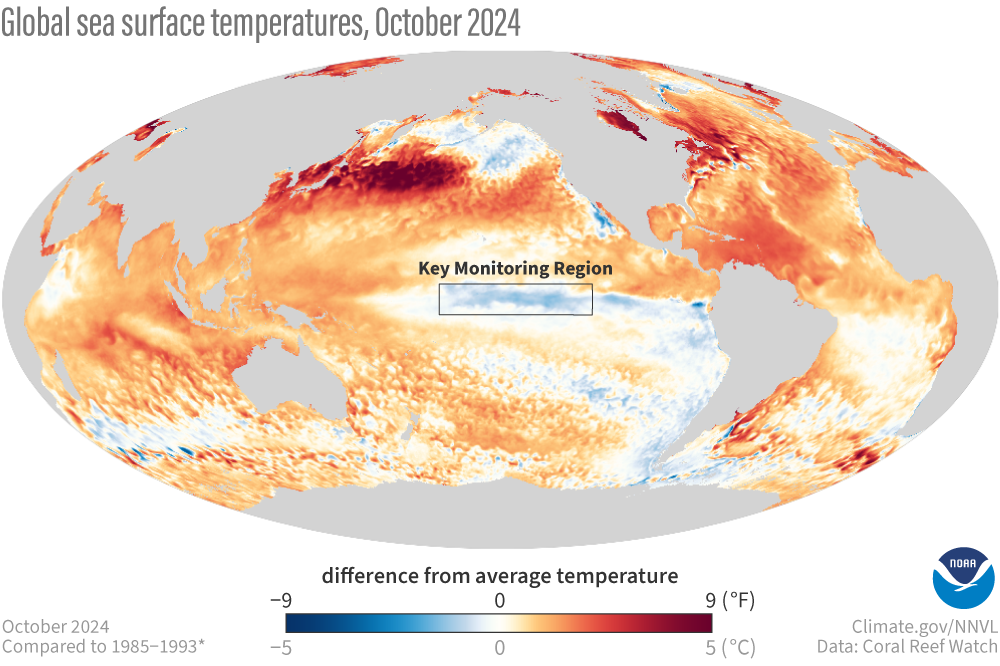
Image caption
October 2024 sea surface temperature difference from the 1985-1993 average (details from Coral Reef Watch). The box indicates the location of the Niño-3.4 ENSO monitoring region in the tropical Pacific. The surface of the Niño-3.4 region in October was only slightly cooler than the 1985-1993 average, but it was quite cool relative to the rest of the global tropics. NOAA Climate.gov image from Data Snapshots.