
Image caption
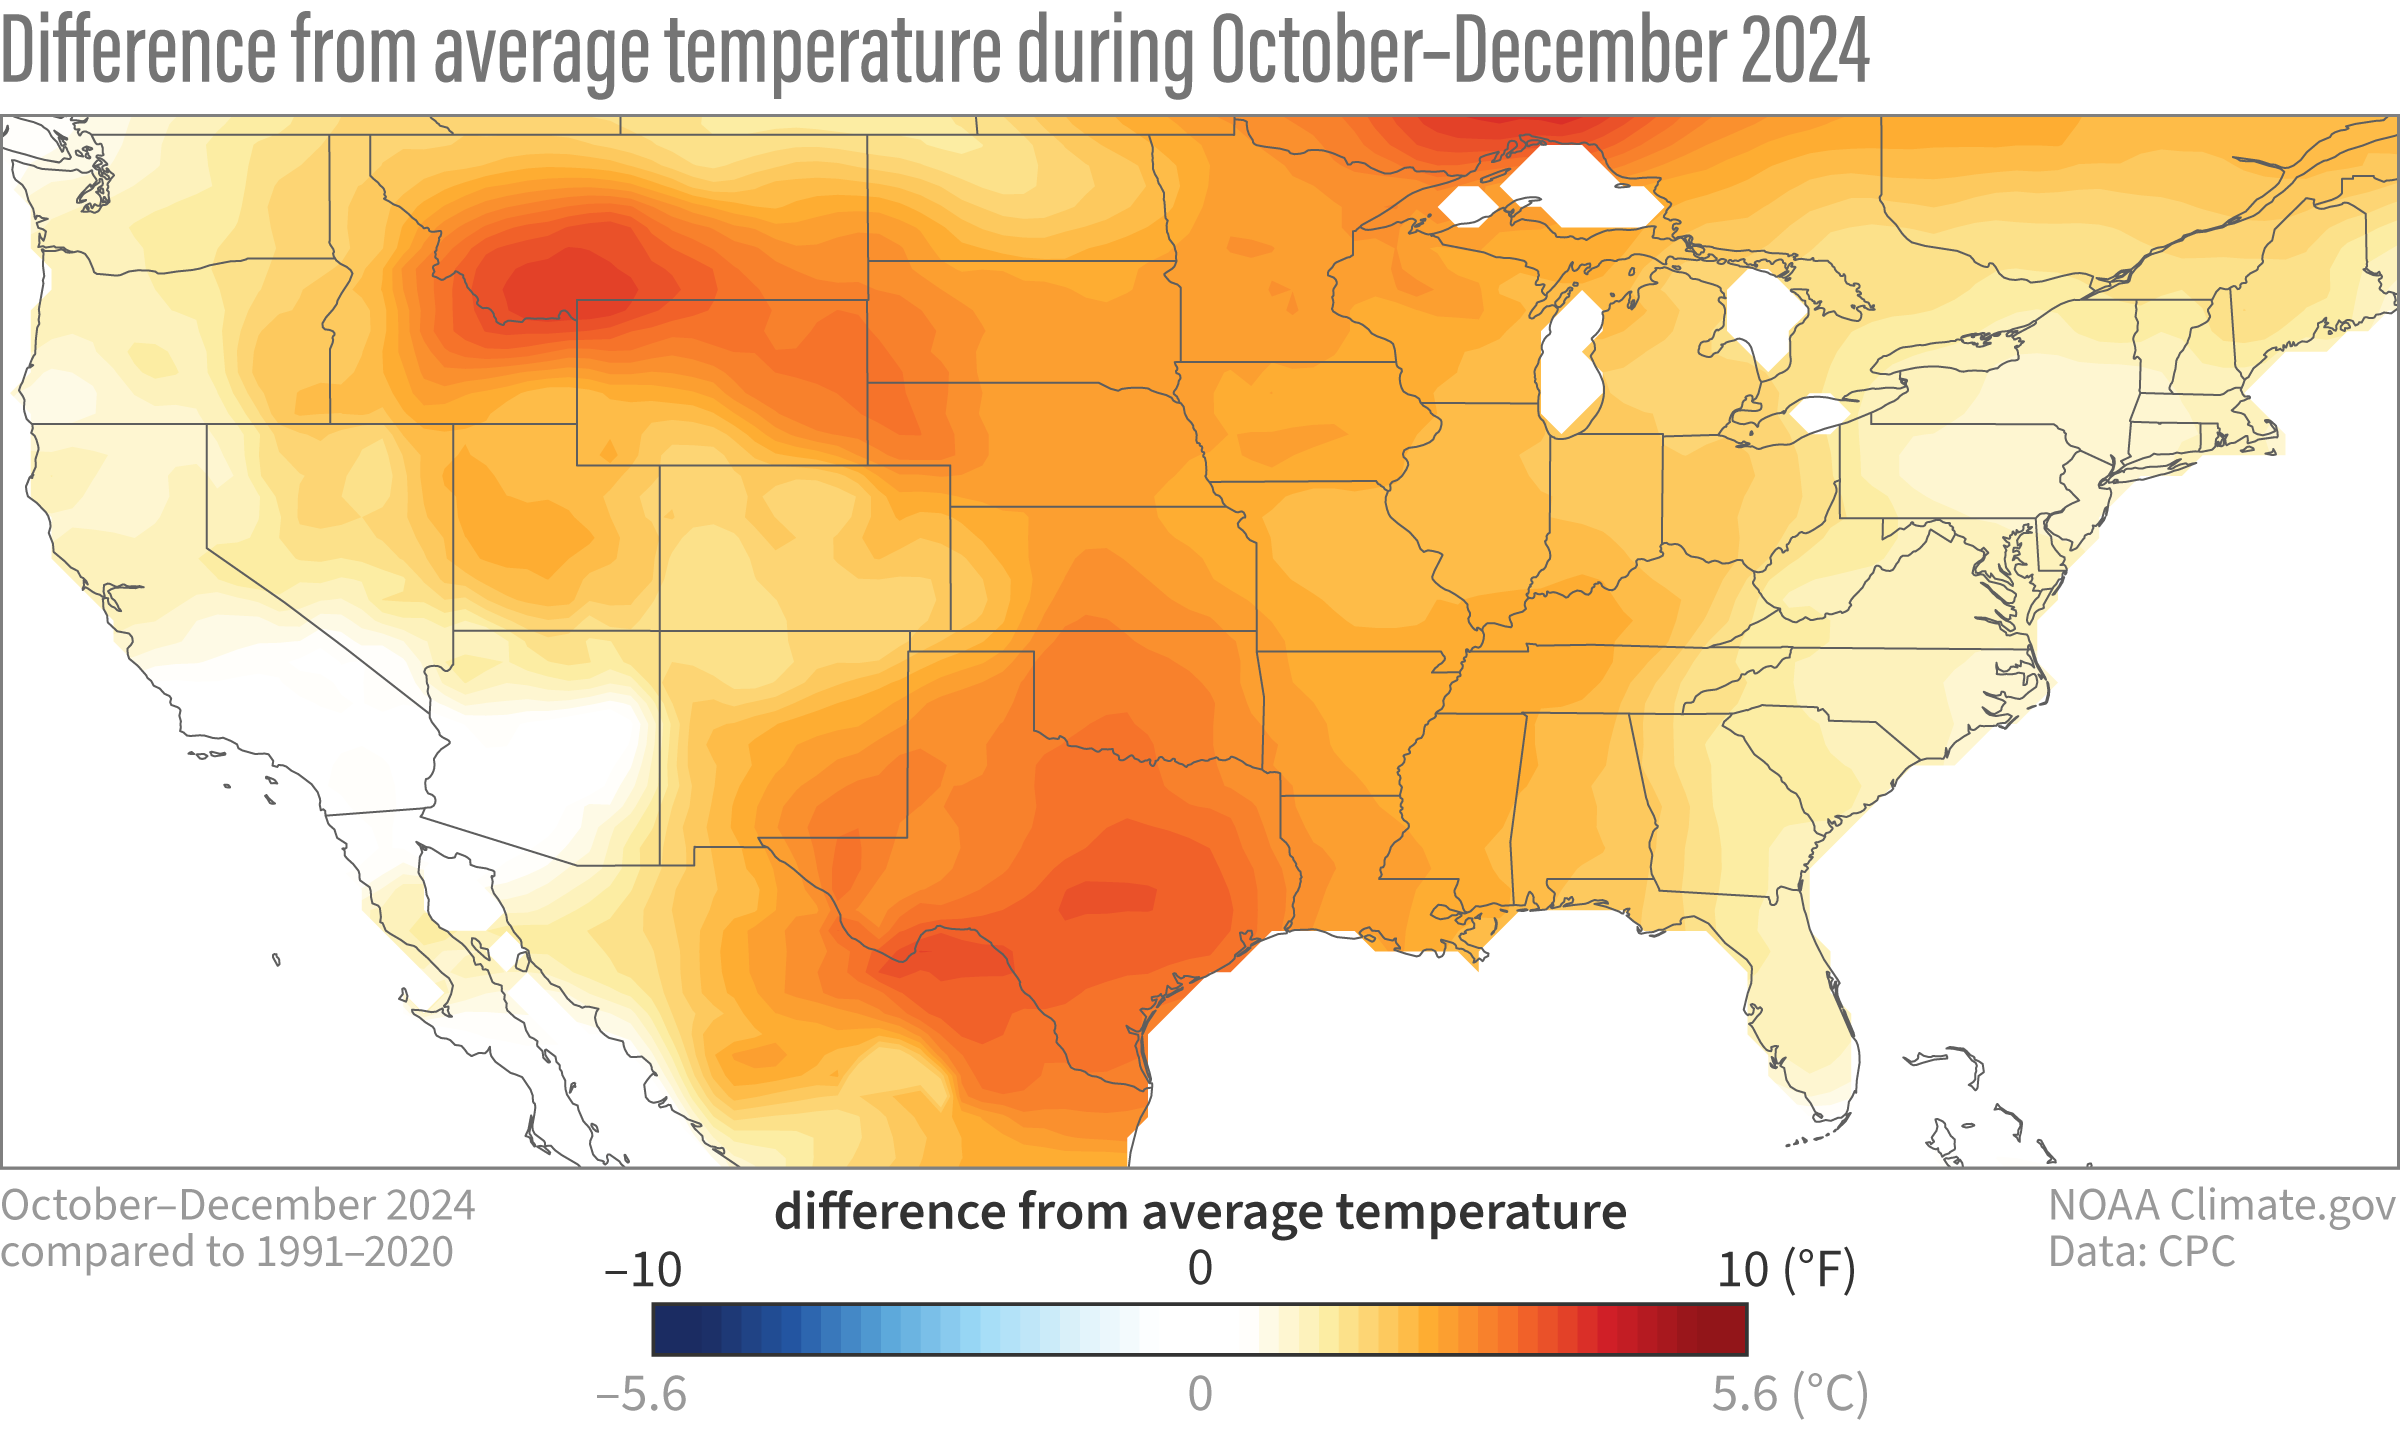
Map showing the difference from average temperature during October–December 2024. Orange areas were warmer than the 1991–2020 average. The pattern here resembles what we would expect in October–December from combined climate trends and La Nina. Map by climate.gov from CPC data.