Image caption
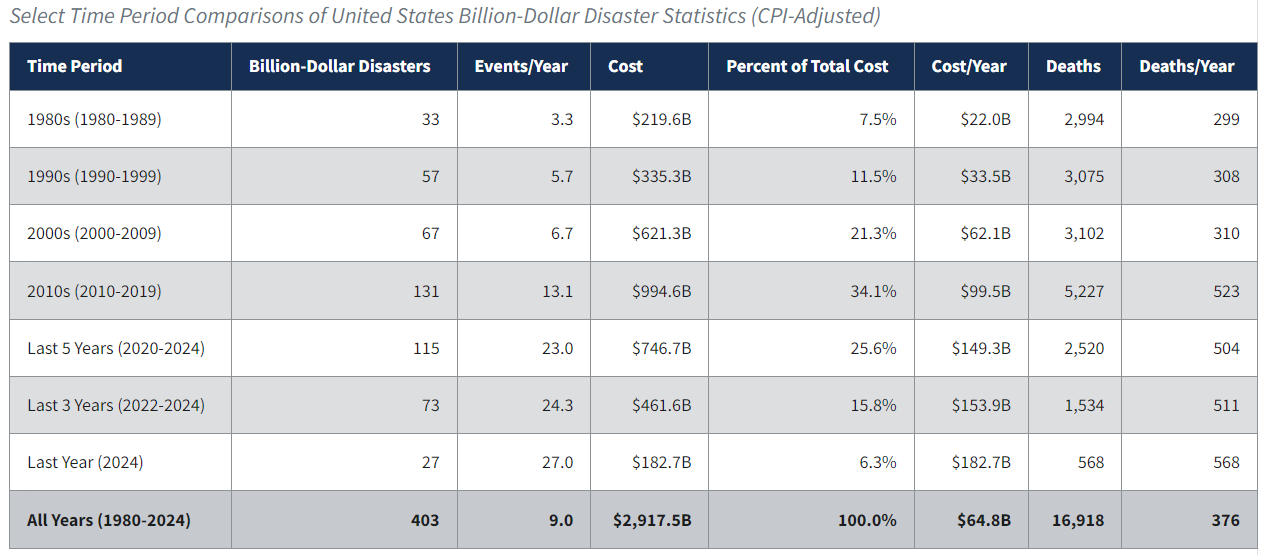
This table shows summary statistics of billion-dollar disasters by decade and by latest 1, 3-, and 5-year periods. Costs over the last complete decade, the 5-year average, and the 3-year average are all higher than the costs of the 1980s, 1990s, and 2000s. Screenshot from NOAA NCEI Billion-dollar Disasters webpage.