
Image caption
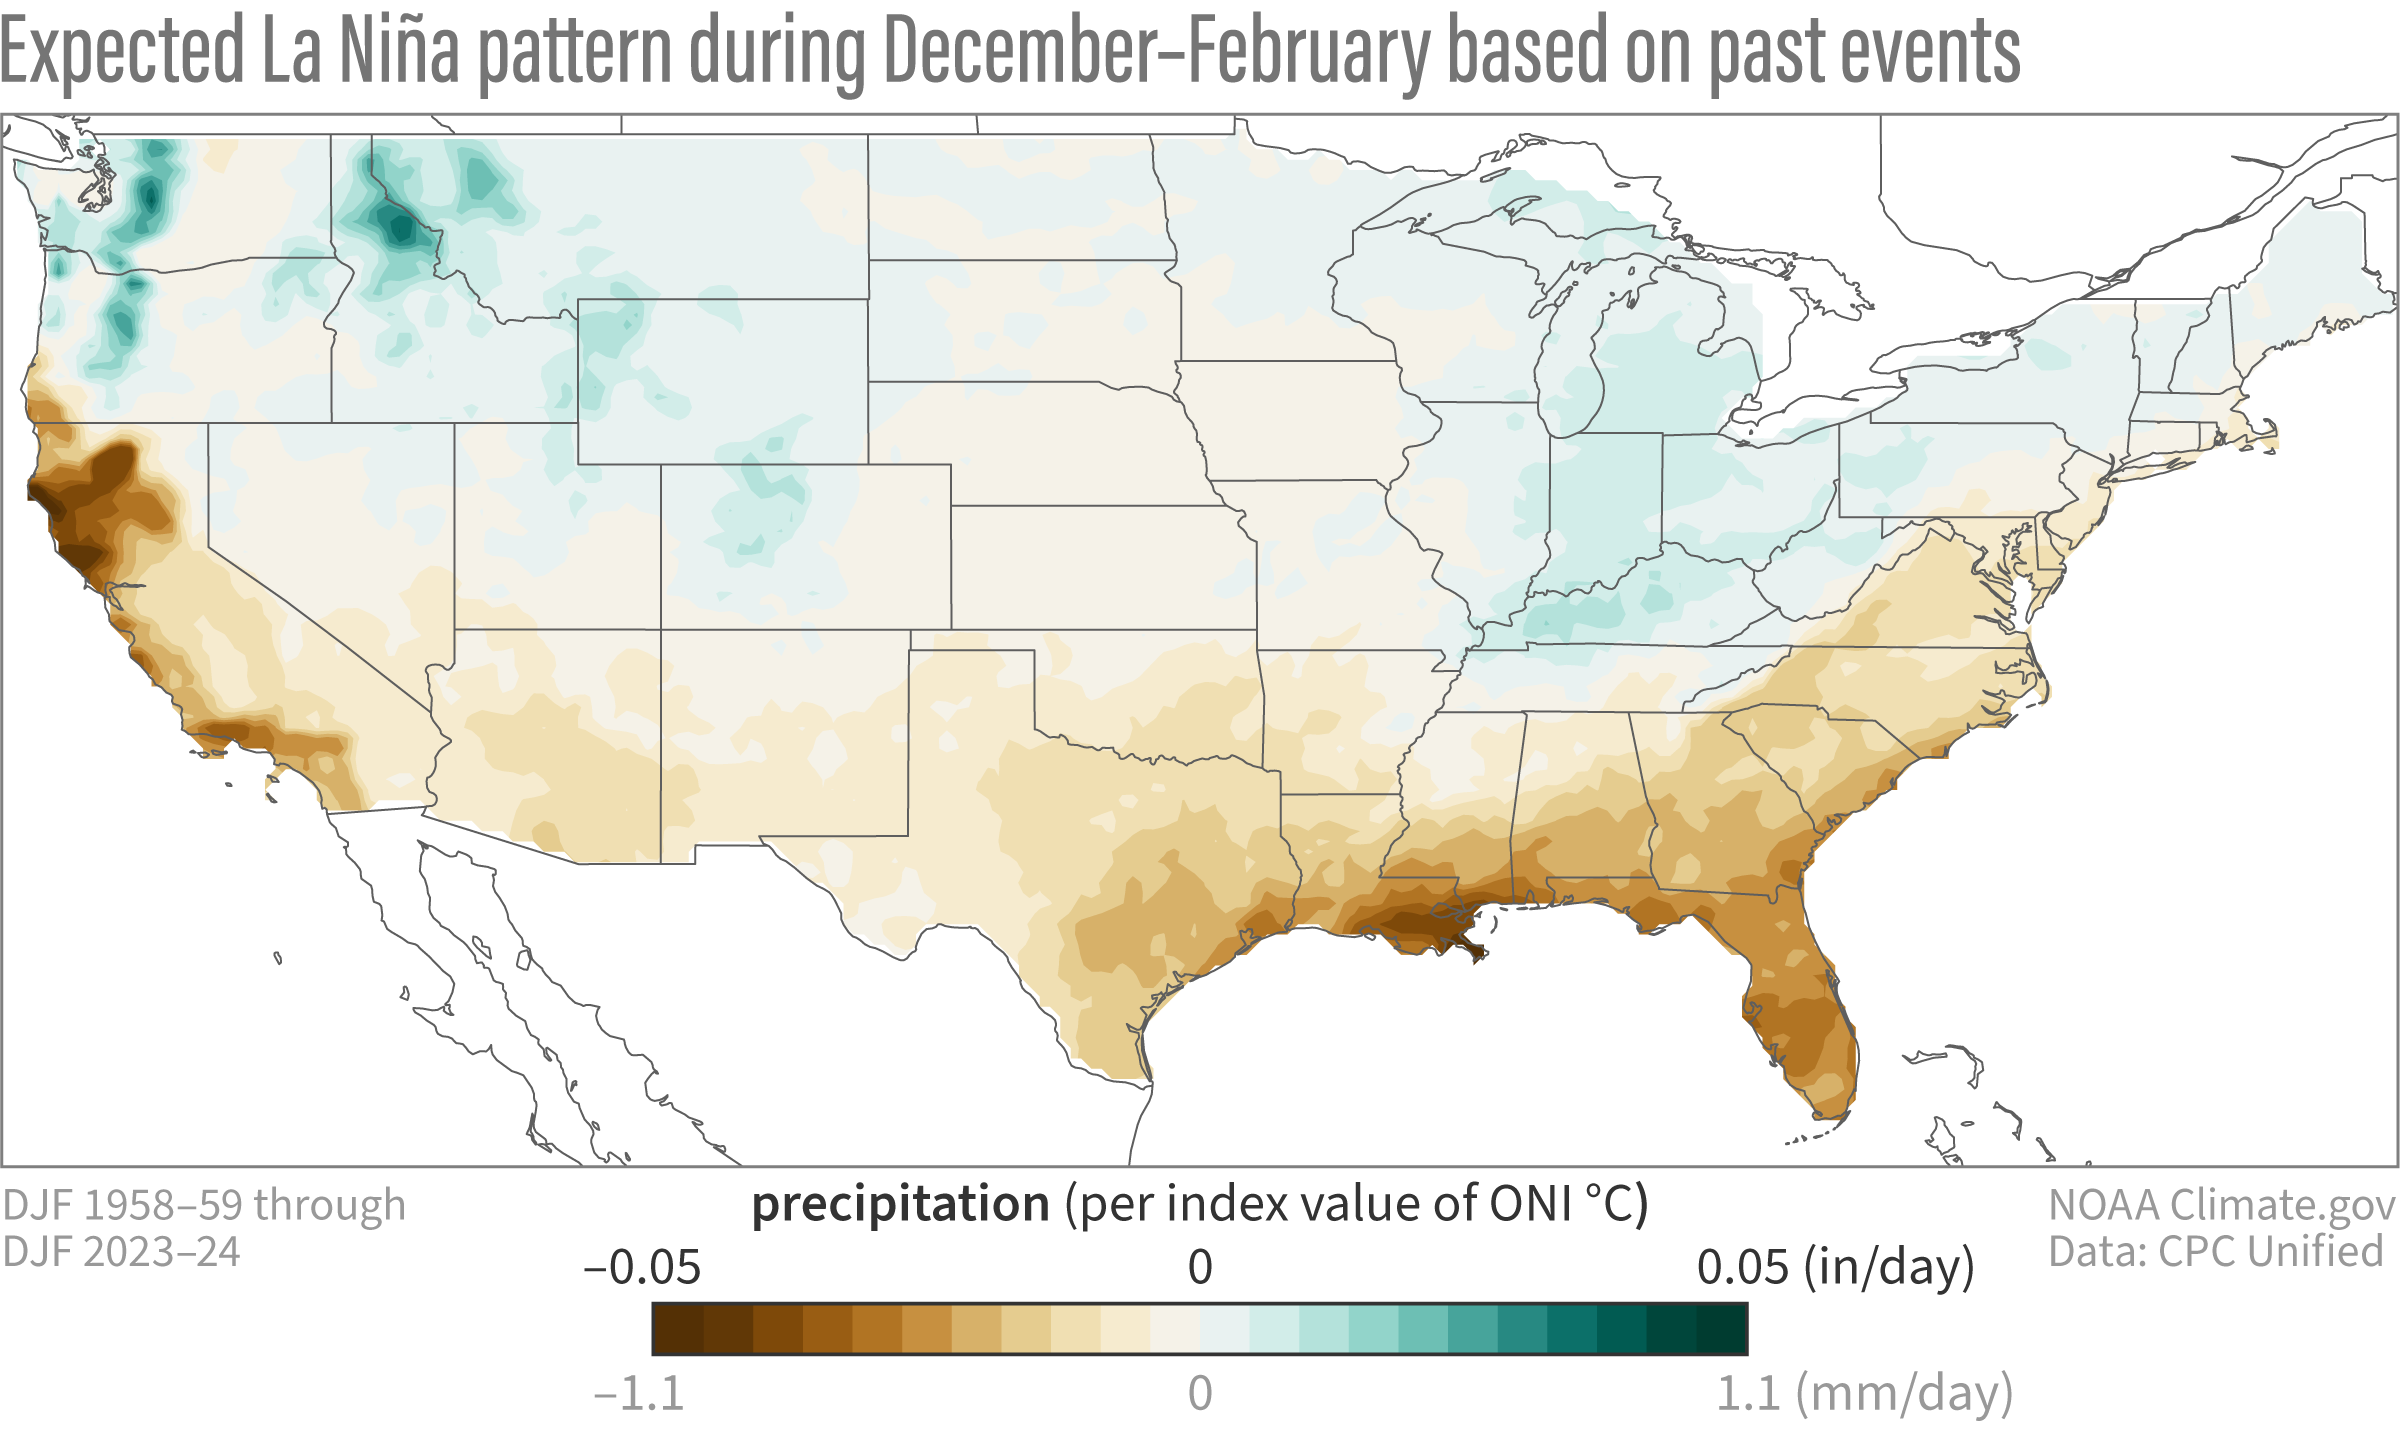
The expected La Niña precipitation anomalies based on past December-February winters from 1959-2024. Green shading shows where conditions are expected to be wetter and brown shading shows where it is expected to be drier. See footnotes #1 and #2 for more details. Map by climate.gov based on analysis by M. L’Heureux (reference).