
Image caption
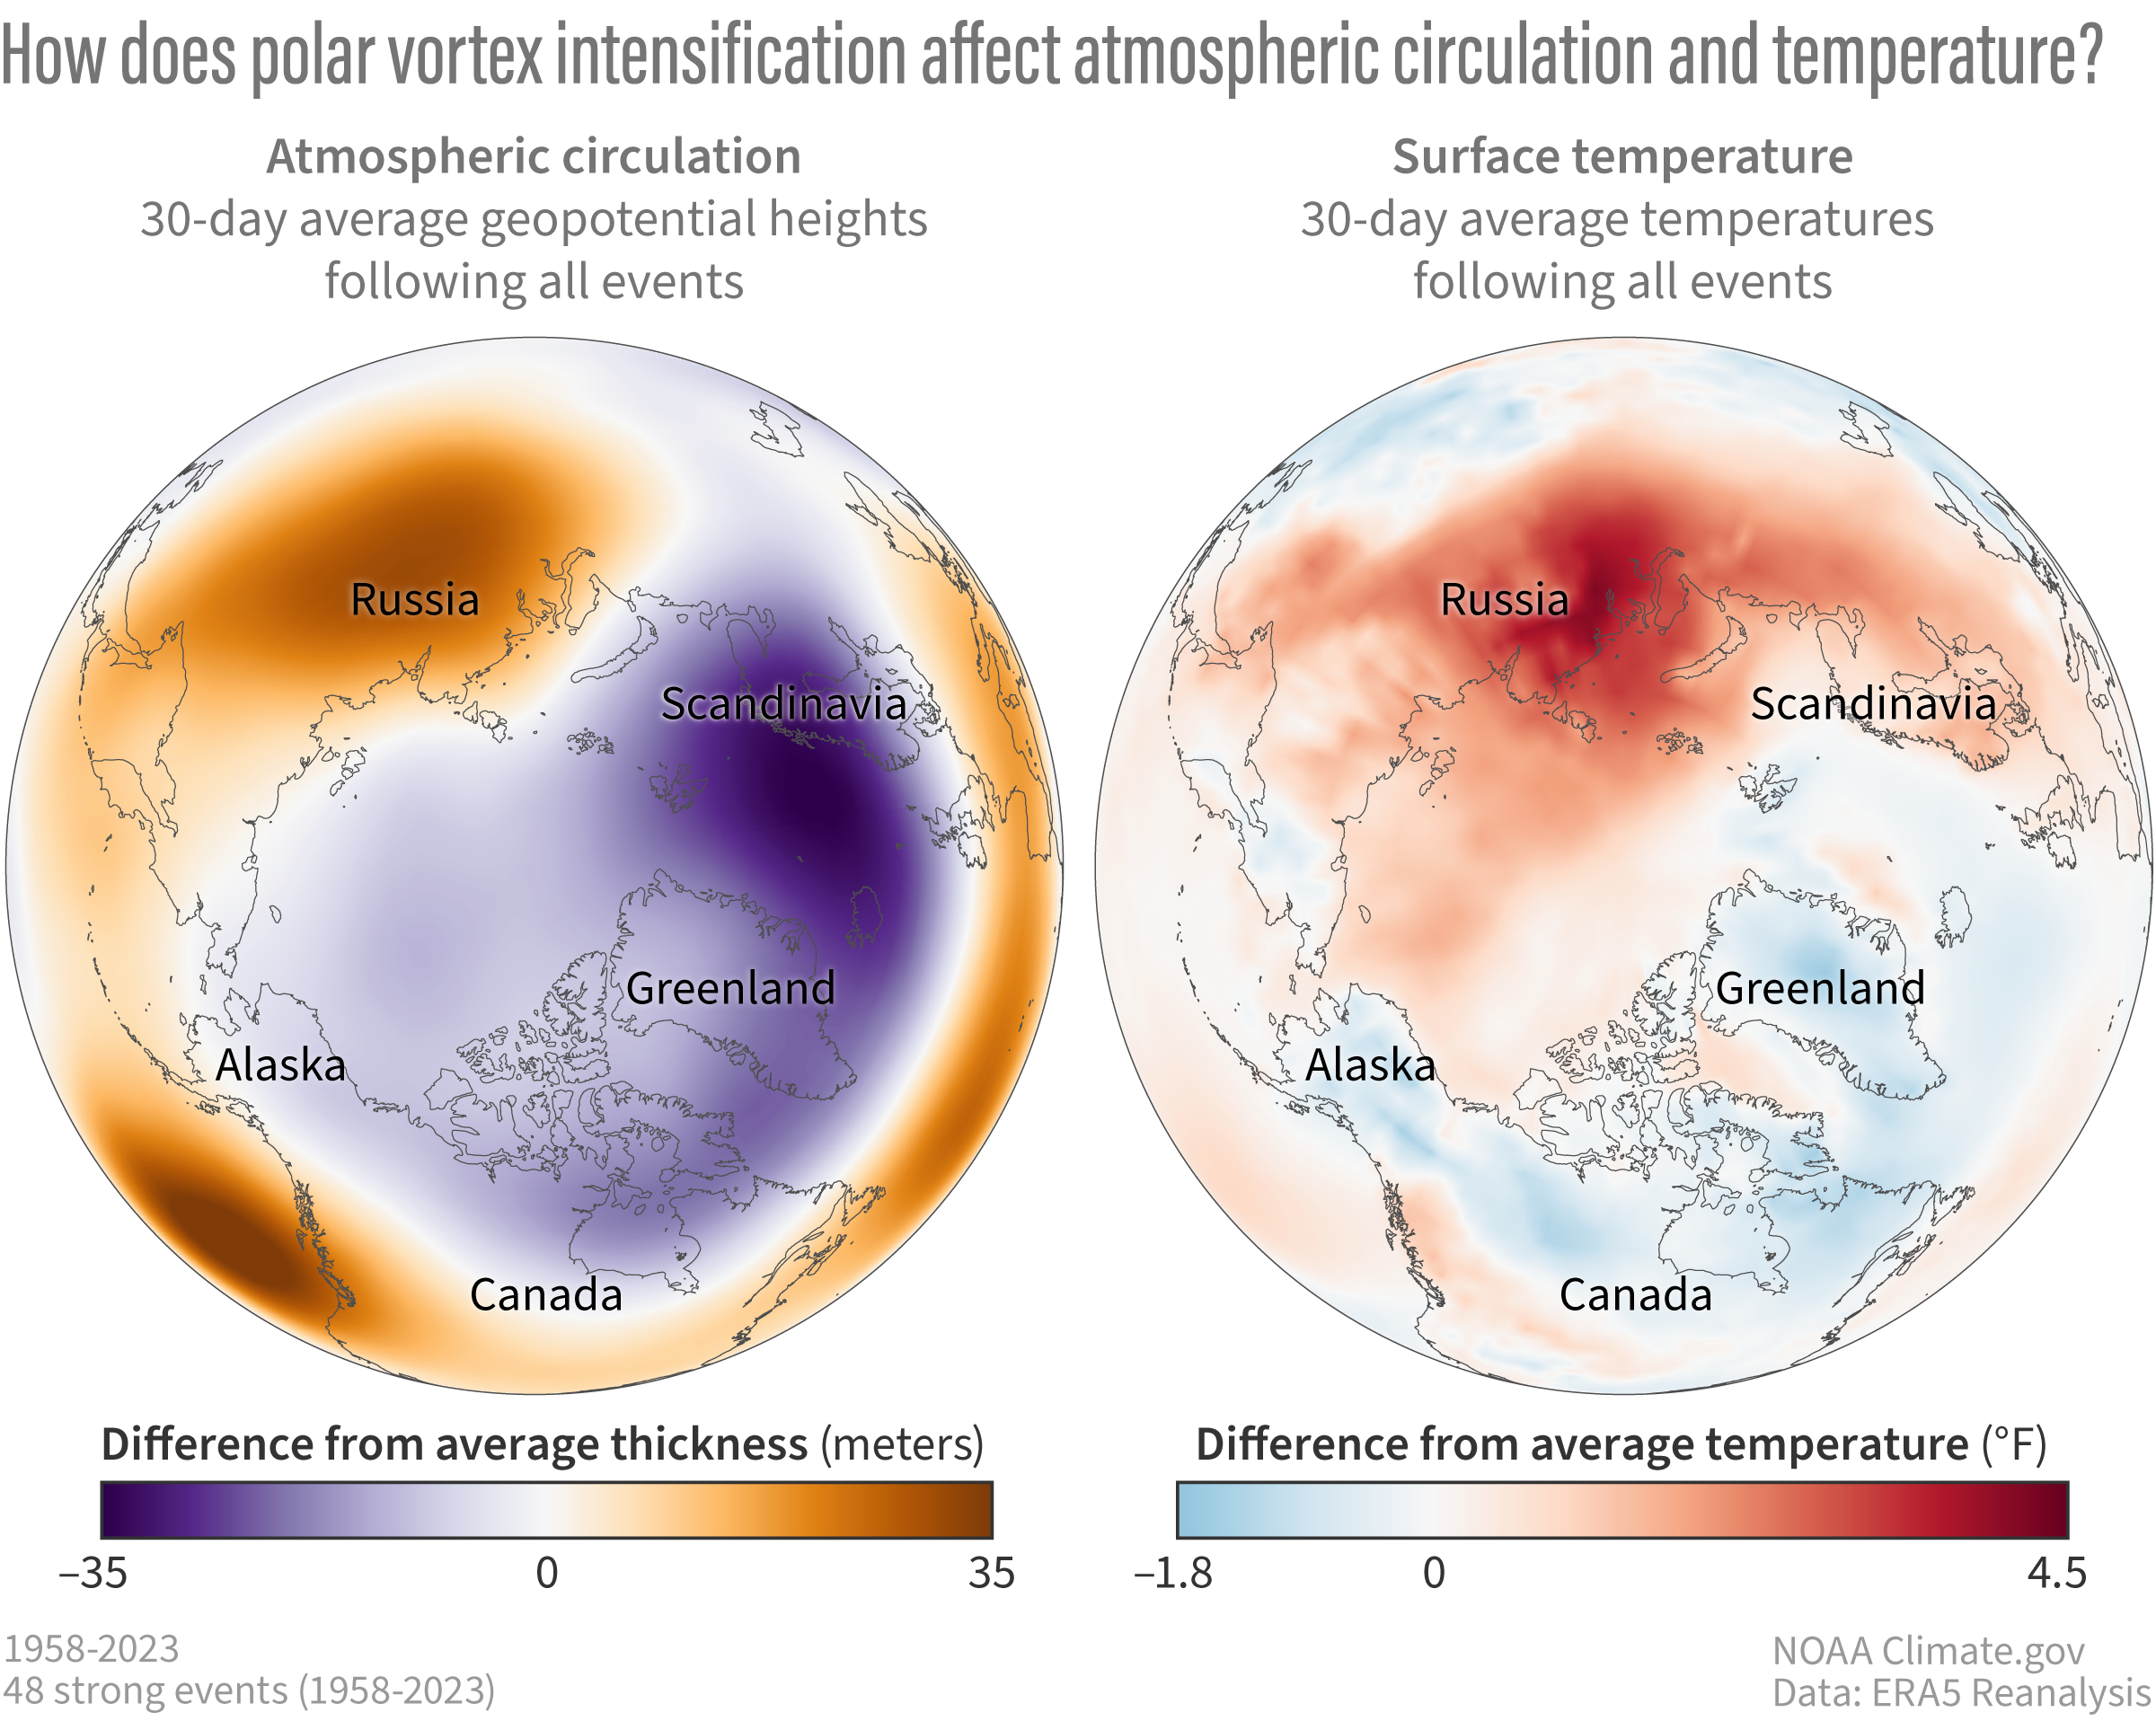
How atmospheric thickness (left) and surface temperature (right) compare to the 1958-2023 average for the 30 days after the 48 observed polar vortex intensification events from 1958-2023. On average, intensification events are followed by lower-than-average thickness (purple) at the 500 hectoPascal pressure level, or about 3.5 miles (5.5 km) in altitude, and cooler-than-average surface temperatures (blue) across much of the Arctic. Across the mid-latitudes, it’s the opposite. NOAA Climate.gov image based on ERA5 reanalysis data provided by Amy Butler.