
Image caption
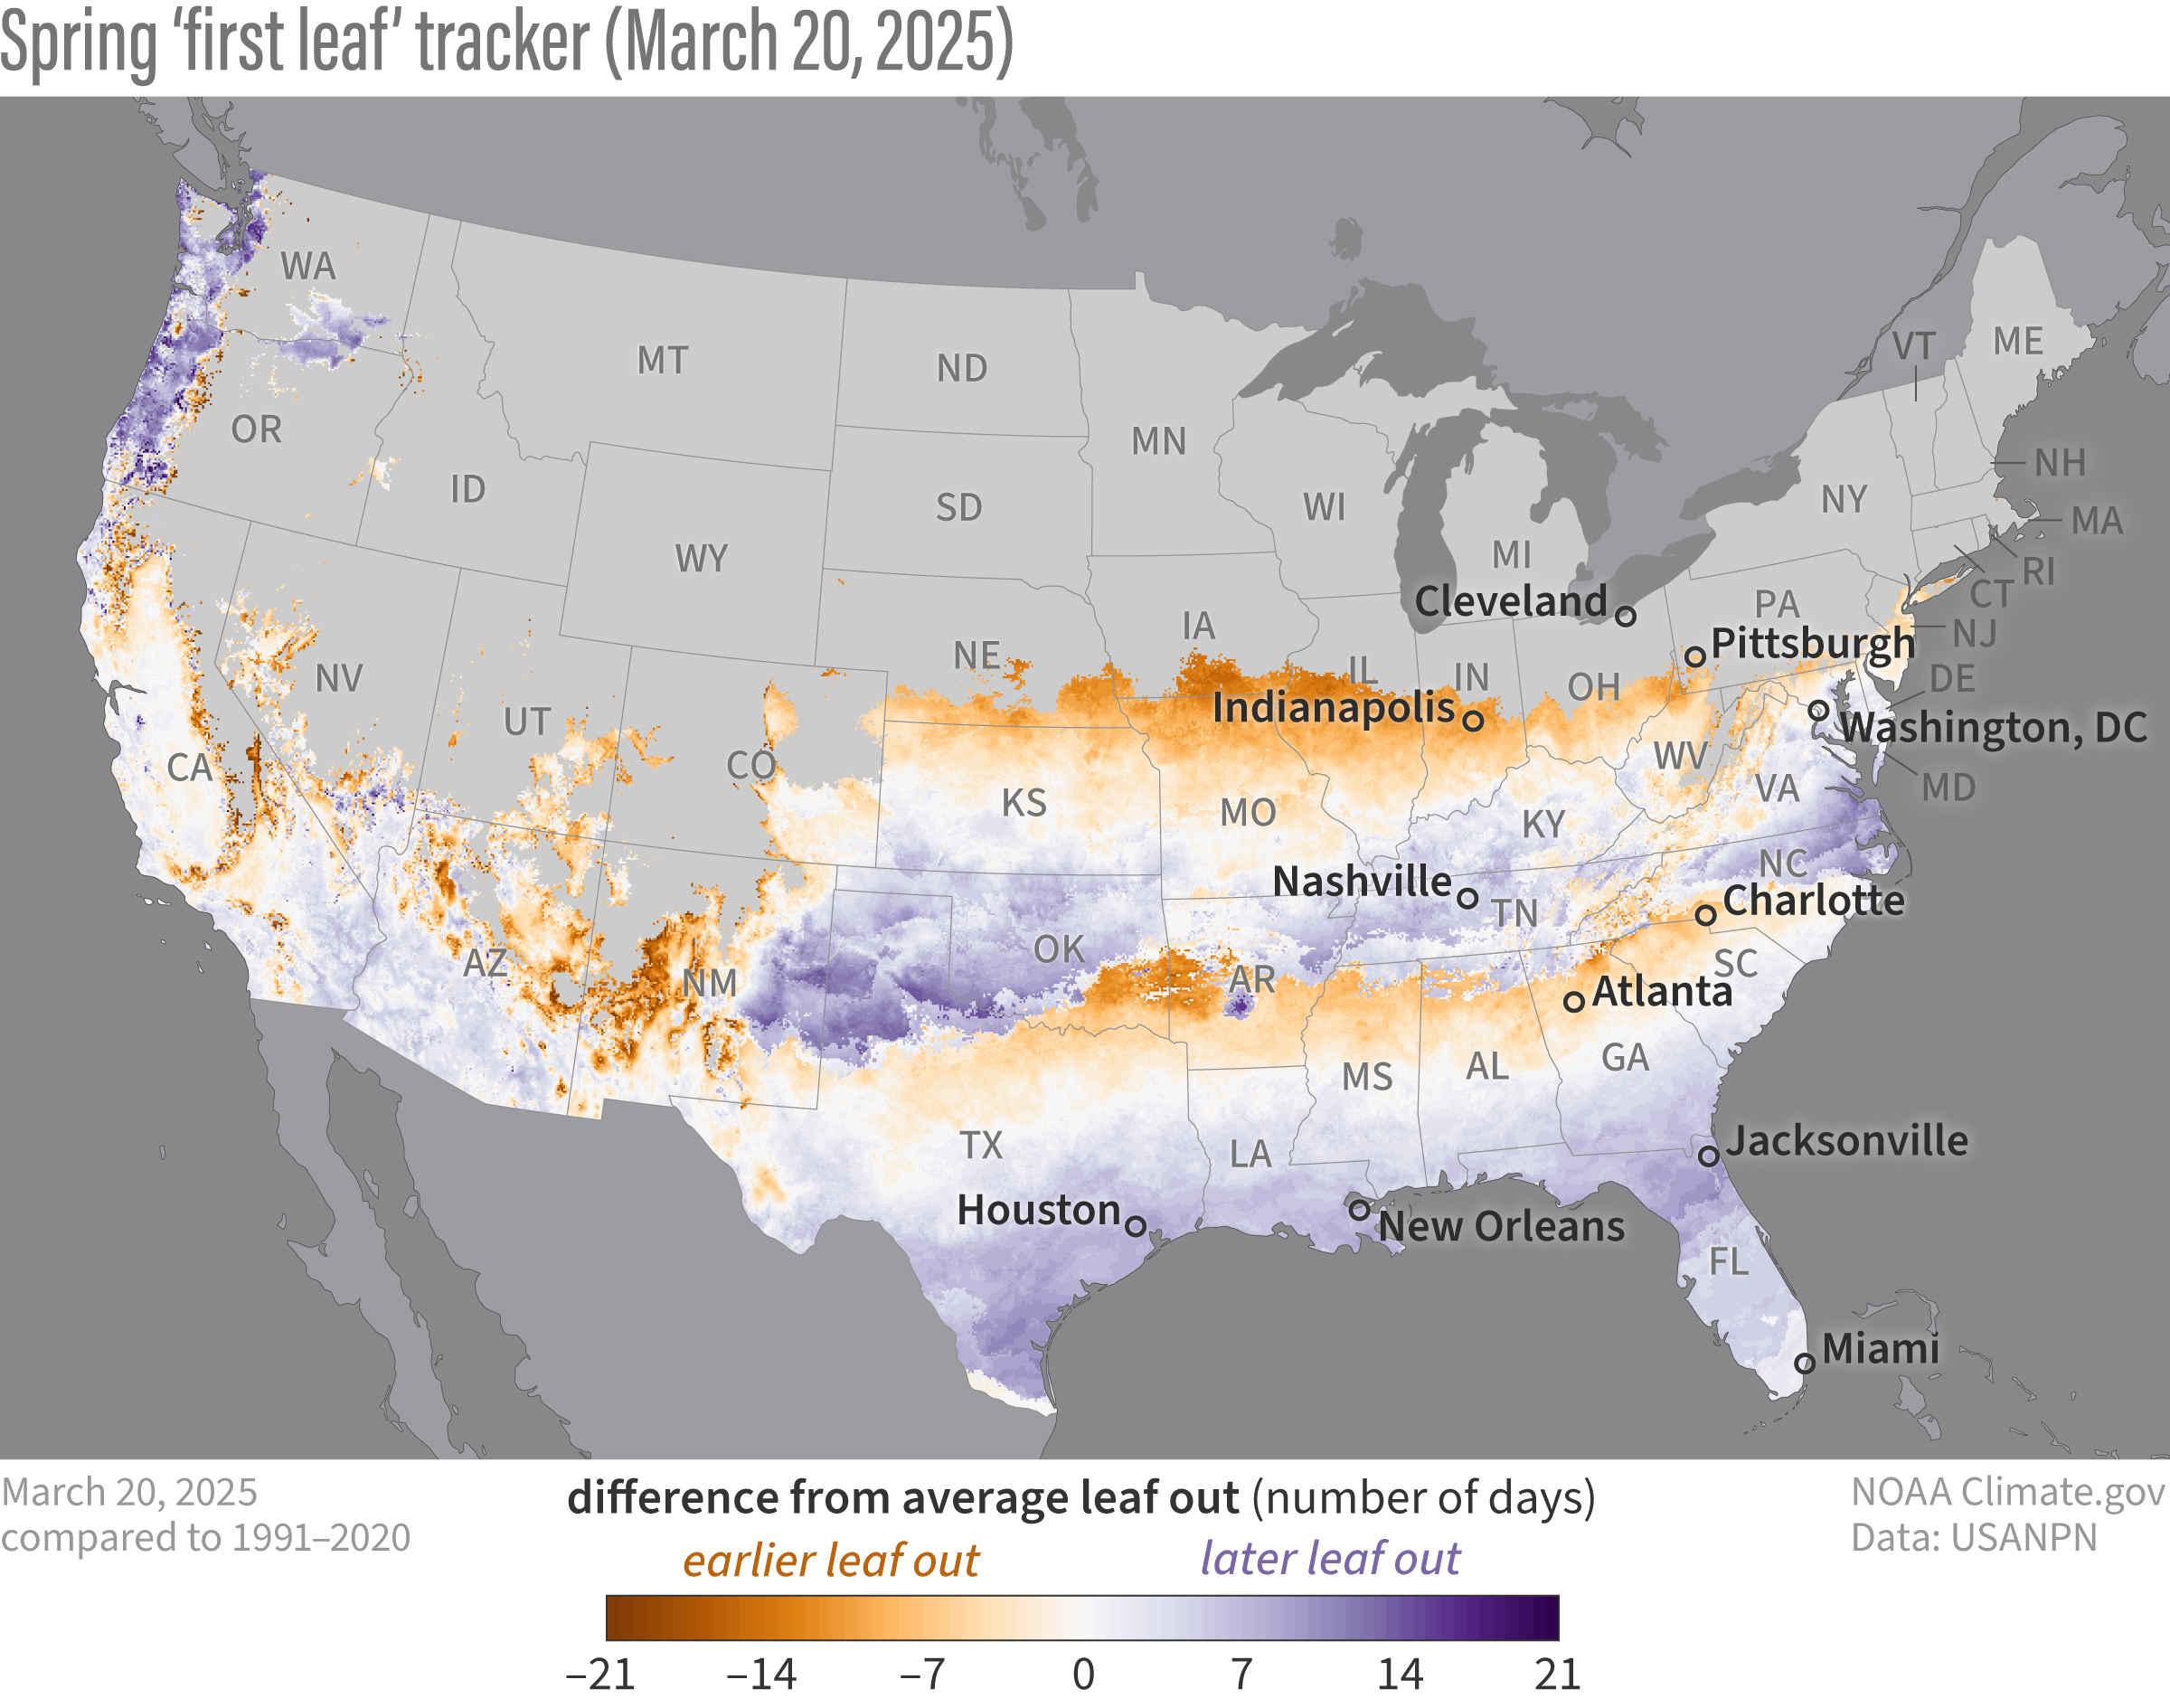
Map of the progress of spring, showing when and where the first signs of spring appear, also known as 'first leaf' or 'leaf out'. Areas where spring is arriving early, compared to the long-term average, are shown in orange while areas where the start of spring is arriving late are shown in purple. The number of days early or late is found by taking the difference between this year's first leaf date (Spring First Leaf Index) and the first leaf date from the 30-Year Average Spring Index, both produced by the USA National Phenology Network. These indices are created using ground-based observations for species active in early spring, like lilac and honeysuckle, combined with temperature and weather event data from the National Centers for Environmental Prediction (NCEP) and PRISM. Explore more ways to visualize this data.