Image caption
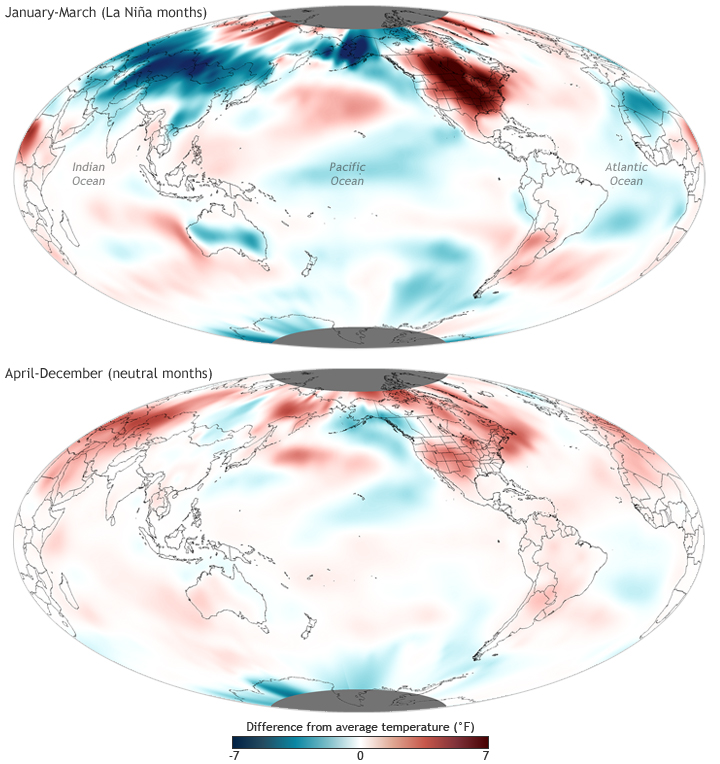
Although 2012 warmth did not top the charts, it was the third warmest “La Niña year” on record. The maps show temperatures relative to average across the globe for different periods January through March (top) and April through December (bottom). (The full year of 2012 is available via the link below the image). Shades of red indicate temperatures up to 7° Fahrenheit warmer than the 1981–2010 average, and shades of blue indicate temperatures up to 7° Fahrenheit cooler than the average.