
Image caption
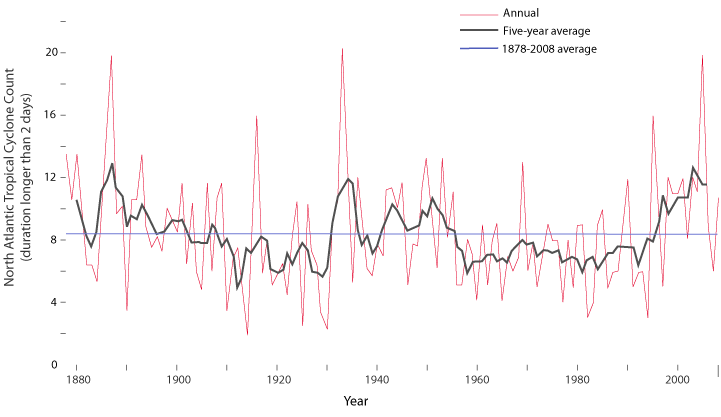
This graph shows annual tropical storm counts for the North Atlantic Ocean. Counts have been adjusted to omit short-duration storms (those that lasted less than 2 days) and to account for storms that were likely missed before satellite observations were available. Graph by LuAnn Dahlman, based on data from Landsea et al. 2010.