
Image caption
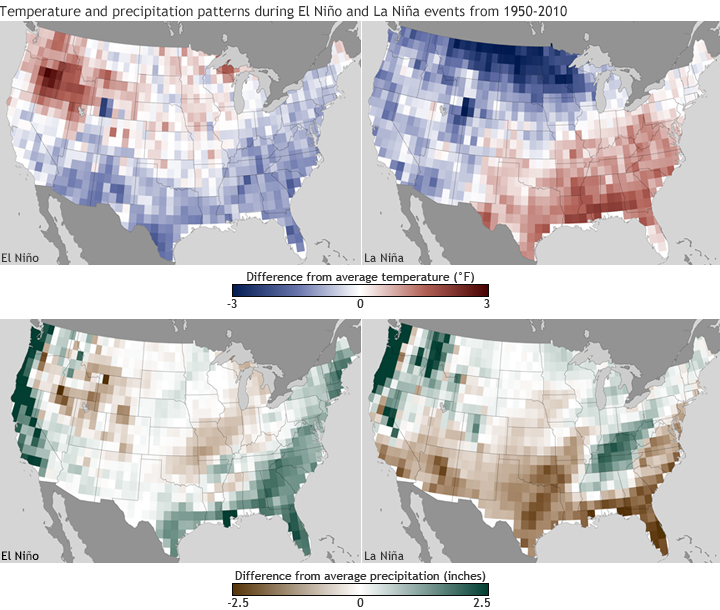
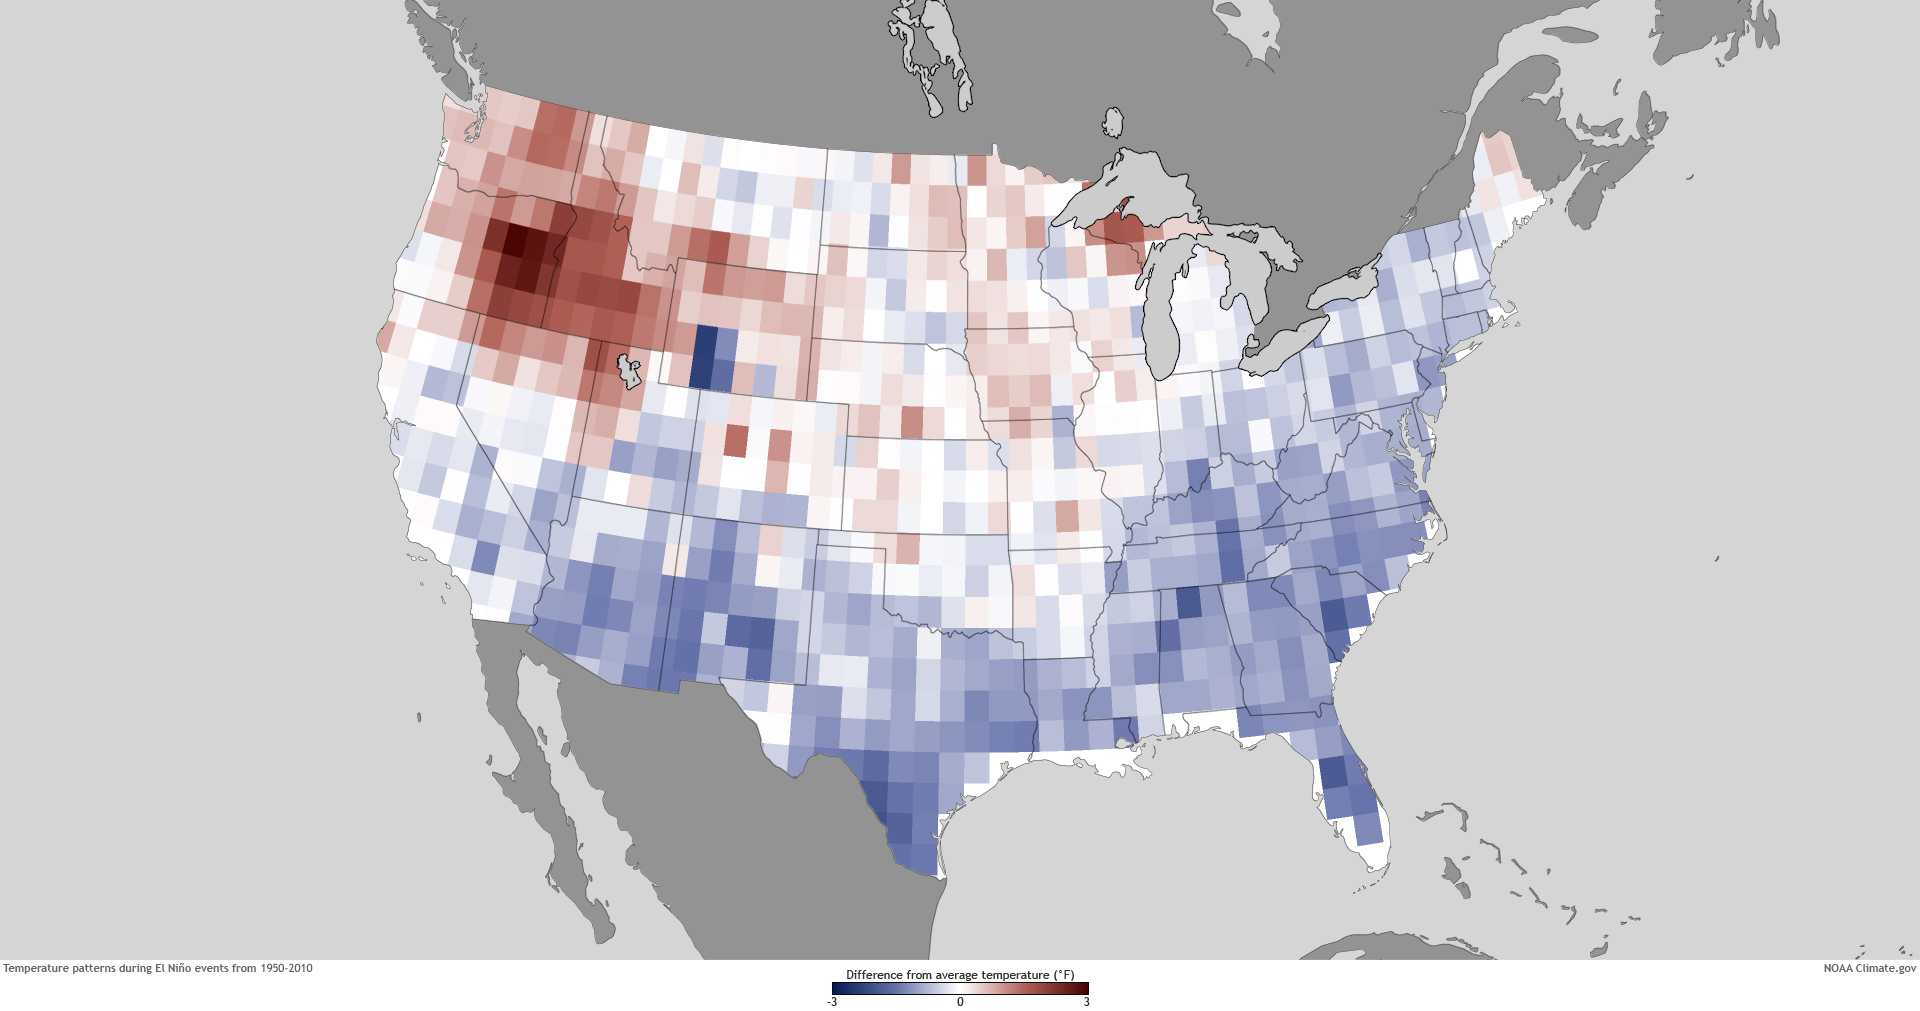
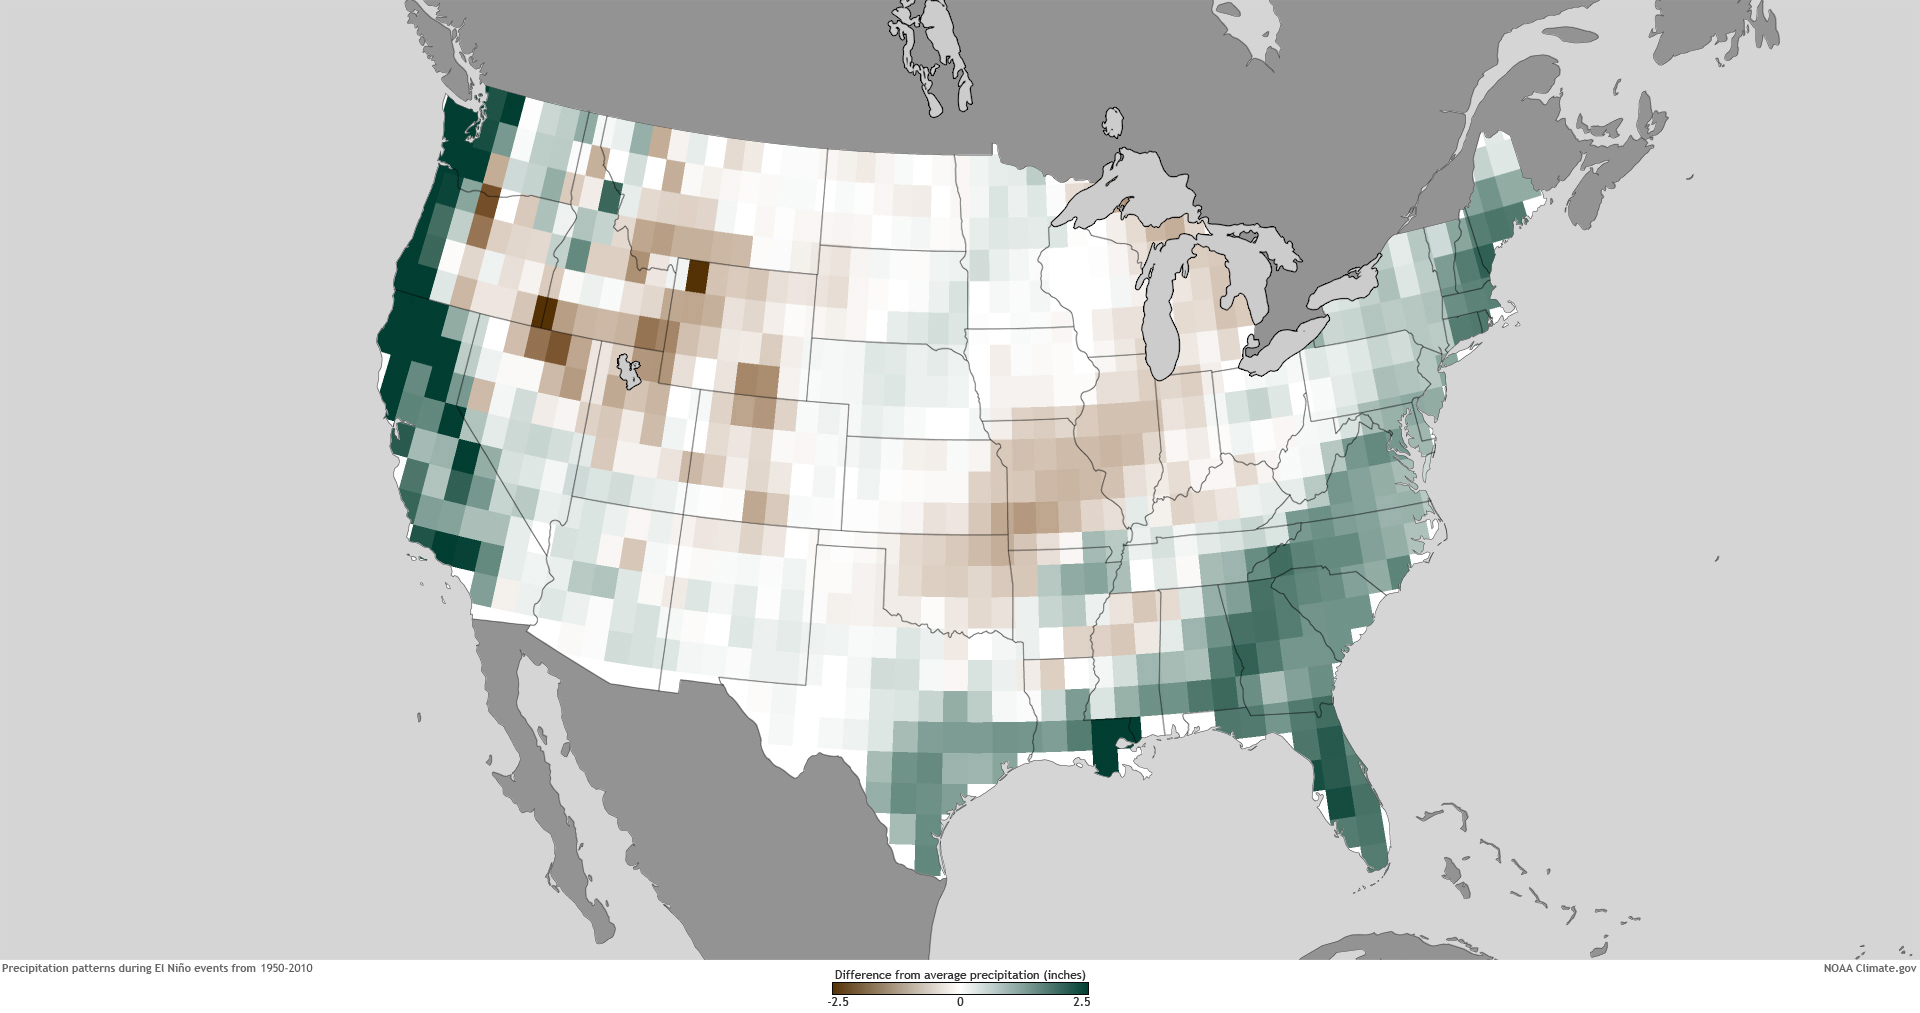
Maps of the difference from average December-February temperature (top row) and precipitation (bottom) during the 22 El Niño and 19 La Niña episodes in the past 60 years. (Maps by NOAA climate.gov team, based on data provided by Michelle L’Heureux, NOAA Climate Prediction Center.) large temperate maps: El Niño | La Niña large precipitation maps: El Niño | La Niña