
Image caption
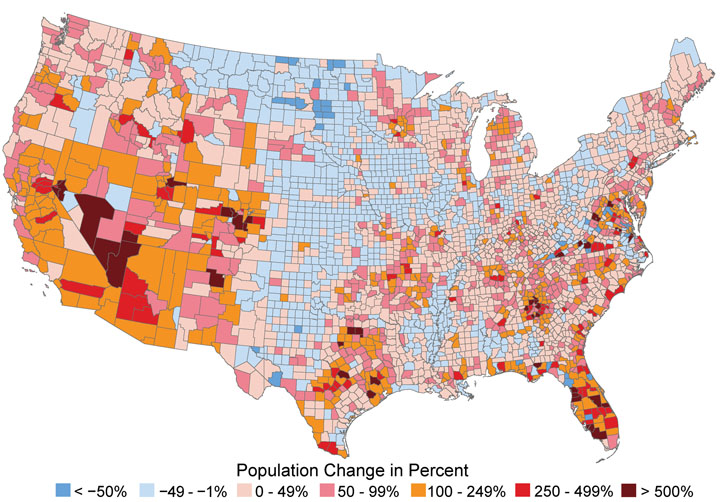
This map shows the percentage change in county populations between 1970 and 2008. Note the orange, red, and maroon areas that show large increases in population, especially in coastal counties in the southeast. Data from U.S. Census; map courtesy of U.S. Global Climate Change Research Program.