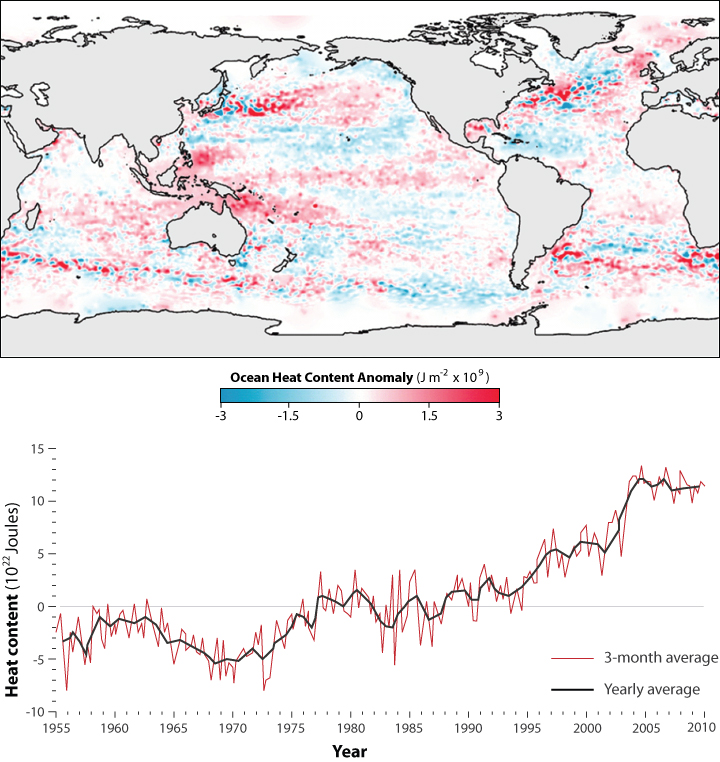
Image caption
A ocean heat content anomaly map and graph showing trends in warming since 1955.
This website is an ARCHIVED version of NOAA Climate.gov as of June 25, 2025.
Content is not being updated or maintained, and some links may no longer work.
A ocean heat content anomaly map and graph showing trends in warming since 1955.