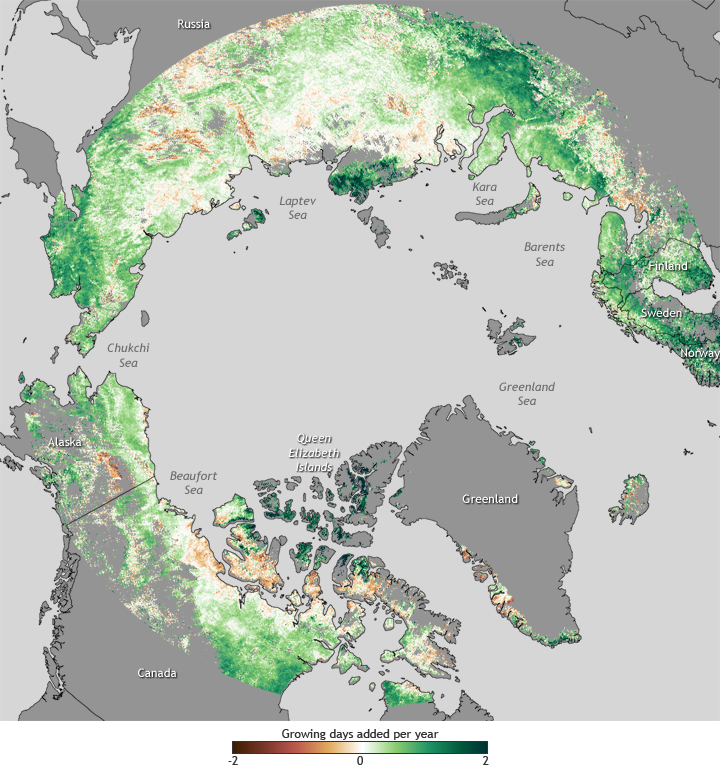
Image caption
The map shows changes in the length of the growing season in high northern latitudes based on satellite observations of vegetation “greenness” between 1982-2008. Green colors indicate places where the growing season increased by up to 2 days per year, while brown colors show places where the growing season became shorter by up to 2 days per year.