
Image caption
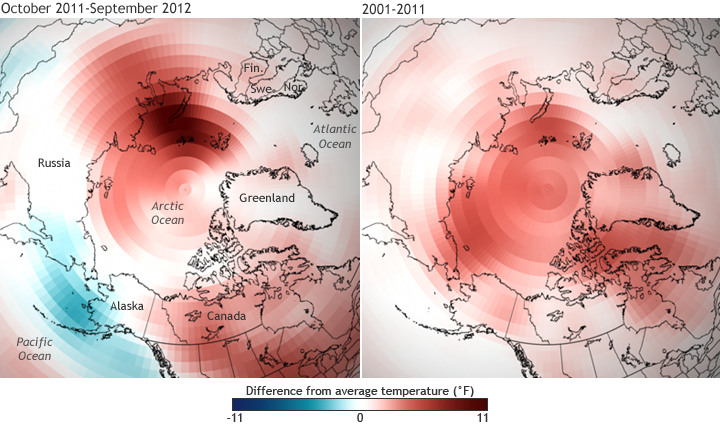
The maps show the difference from average temperatures in the Arctic for October 2011-September 2012 (left) as well as for the first decade of the 21st century (right). The annual map uses the most recent 30-year climatology (1981-2010) while the decadal average is compared to 1971-2000.