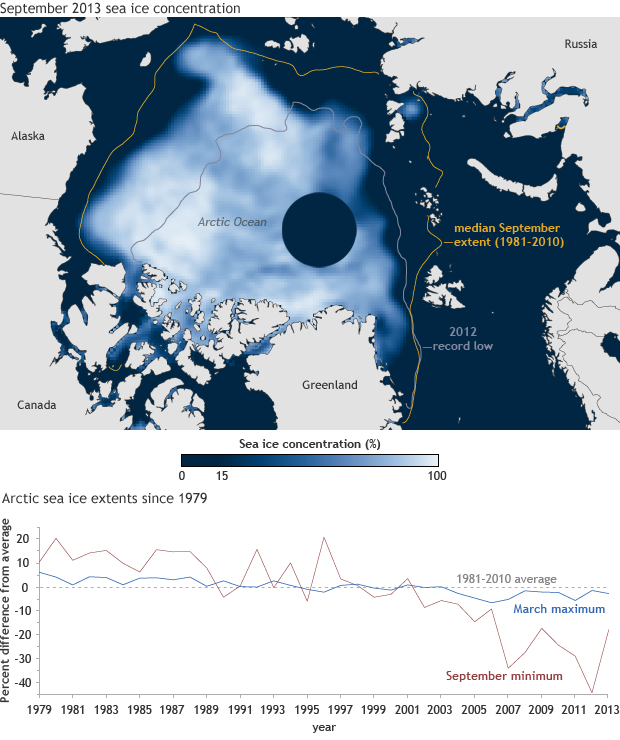
Image caption
(Map) Sea ice concentration in September 2013 compared to the historic median September extent from 1981-2010 and to the 2012 record low. (Graph) Percent difference from average (1981-2010) annual March maximum and September minimum ice extents since 1979. Images by NOAA Climate.gov, based on data from the National Snow and Ice Data Center.