Image caption
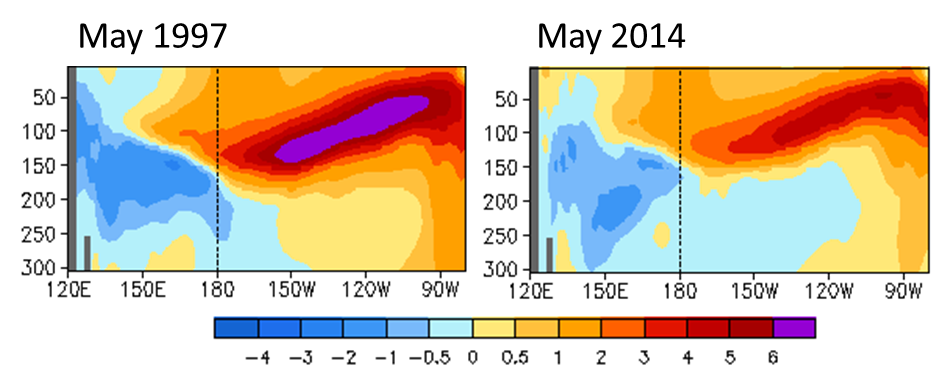
Fig. 2: Subsurface temperature (degrees C) cross-sections from April 1997 (left) and 2014 (right). The figures are showing the average of several different subsurface temperature datasets. Maps based on data from the Real Time Multiple Ocean Reanalysis Intercomparison website.