
Image caption
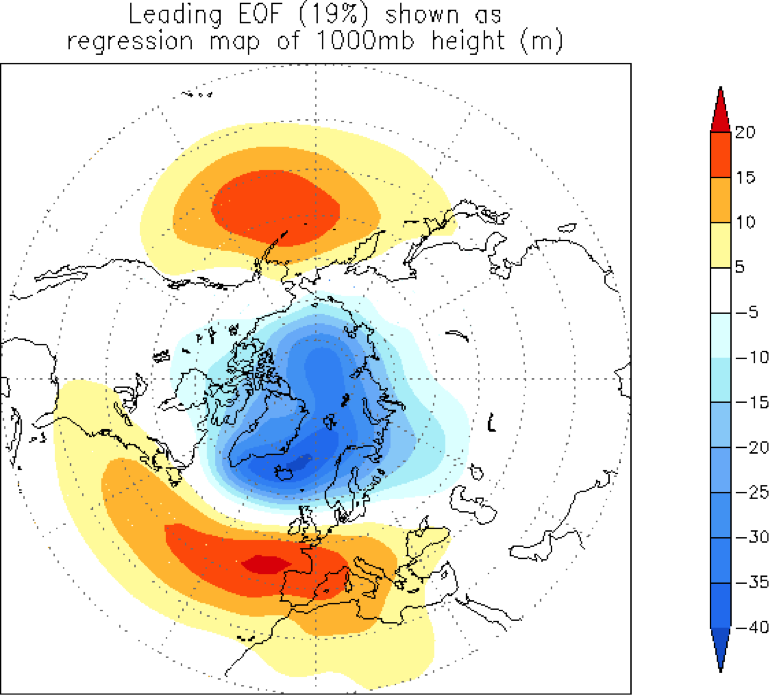
Map showing surface pressure anomaly pattern of the Arctic Oscillation in its positive phase, using the statistical technique of unrotated principal components analysis, which is another way to define typical preferred anomaly patterns. The units are height (meters) of the 1000mb pressure surface. Image credit: NOAA Climate Prediction Center.