
Image caption
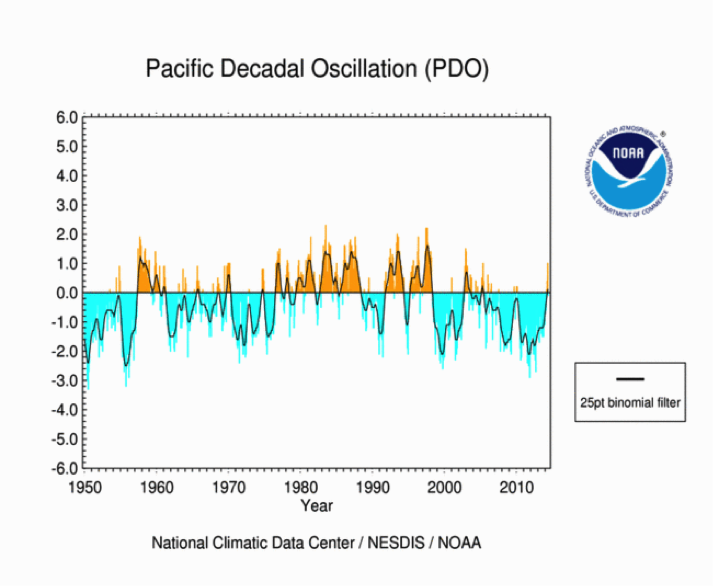
Sea surface temperature pattern showing the warm phase of the Pacific Decadal Oscillation (top). The status of the PDO between 1950 and this year, shown at bottom, indicates a predominantly positive phase from about 1978 to 1998 and negative phase since 1999. Image Credit: Climate Impacts Group, University of Washington.