
Image caption
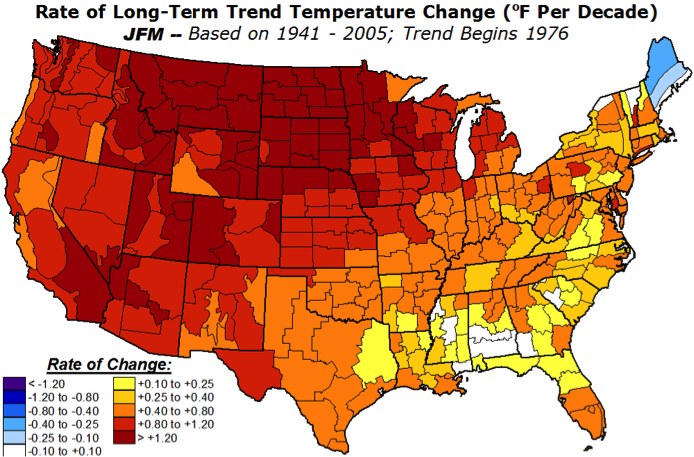
Temperature trend for the January-March season (degrees F per 10 years) between 1976 and 2005. Image credit: NOAA Climate Prediction Center.
This website is an ARCHIVED version of NOAA Climate.gov as of June 25, 2025.
Content is not being updated or maintained, and some links may no longer work.
Temperature trend for the January-March season (degrees F per 10 years) between 1976 and 2005. Image credit: NOAA Climate Prediction Center.