
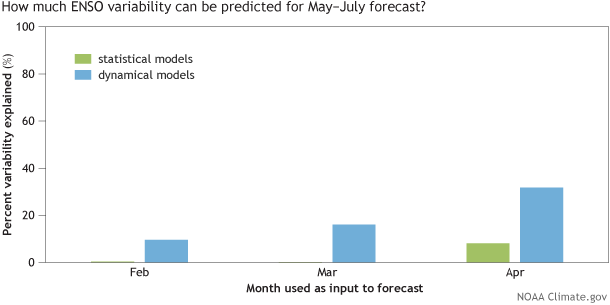
Image caption
The skill (or forecasting ability) of model runs based on February, March, and April observations to predict the May-July (MJJ) average value in the Niño-3.4 SST region (ENSO). Results shown here are an average correlation coefficient from each of the 20 models between 2002-2011 (data used from Barnston et al, 2012). Percent Explained Variance (%) is calculated by squaring the correlation coefficient and multiplying by 100 (see footnote #1). Models that explain all ENSO variability would equal 100%, while explaining none of the ENSO variance would equal 0%. Graphic by Fiona Martin based on data from NOAA CPC and IRI.