
Image caption
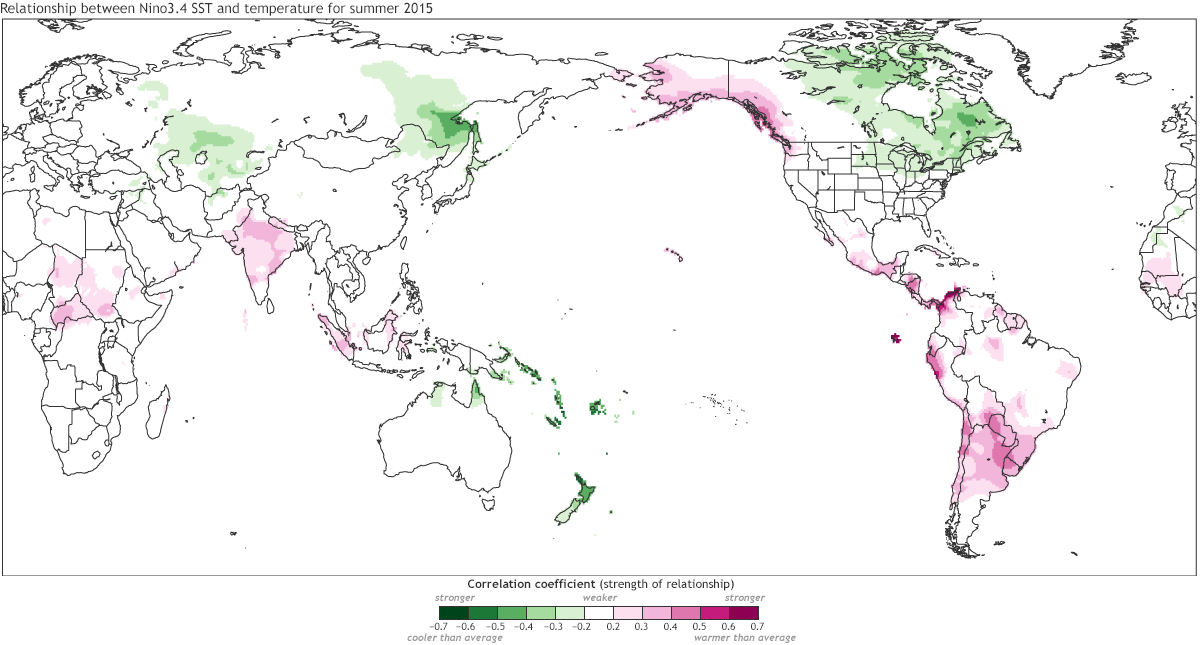
Correlation between the sea surface temperature in the Nino3.4 region in the central tropical Pacific ocean (indicating El Niño when above average) and temperature over the globe. Positive (dark pink) areas indicate higher temperature during El Niño. Correlation values between -0.25 and 0.25 are considered statistically nonsignificant; they could have occurred by chance and therefore should be considered with caution. Map by Climate.gov, based on Climate Prediction Center data.