
Image caption
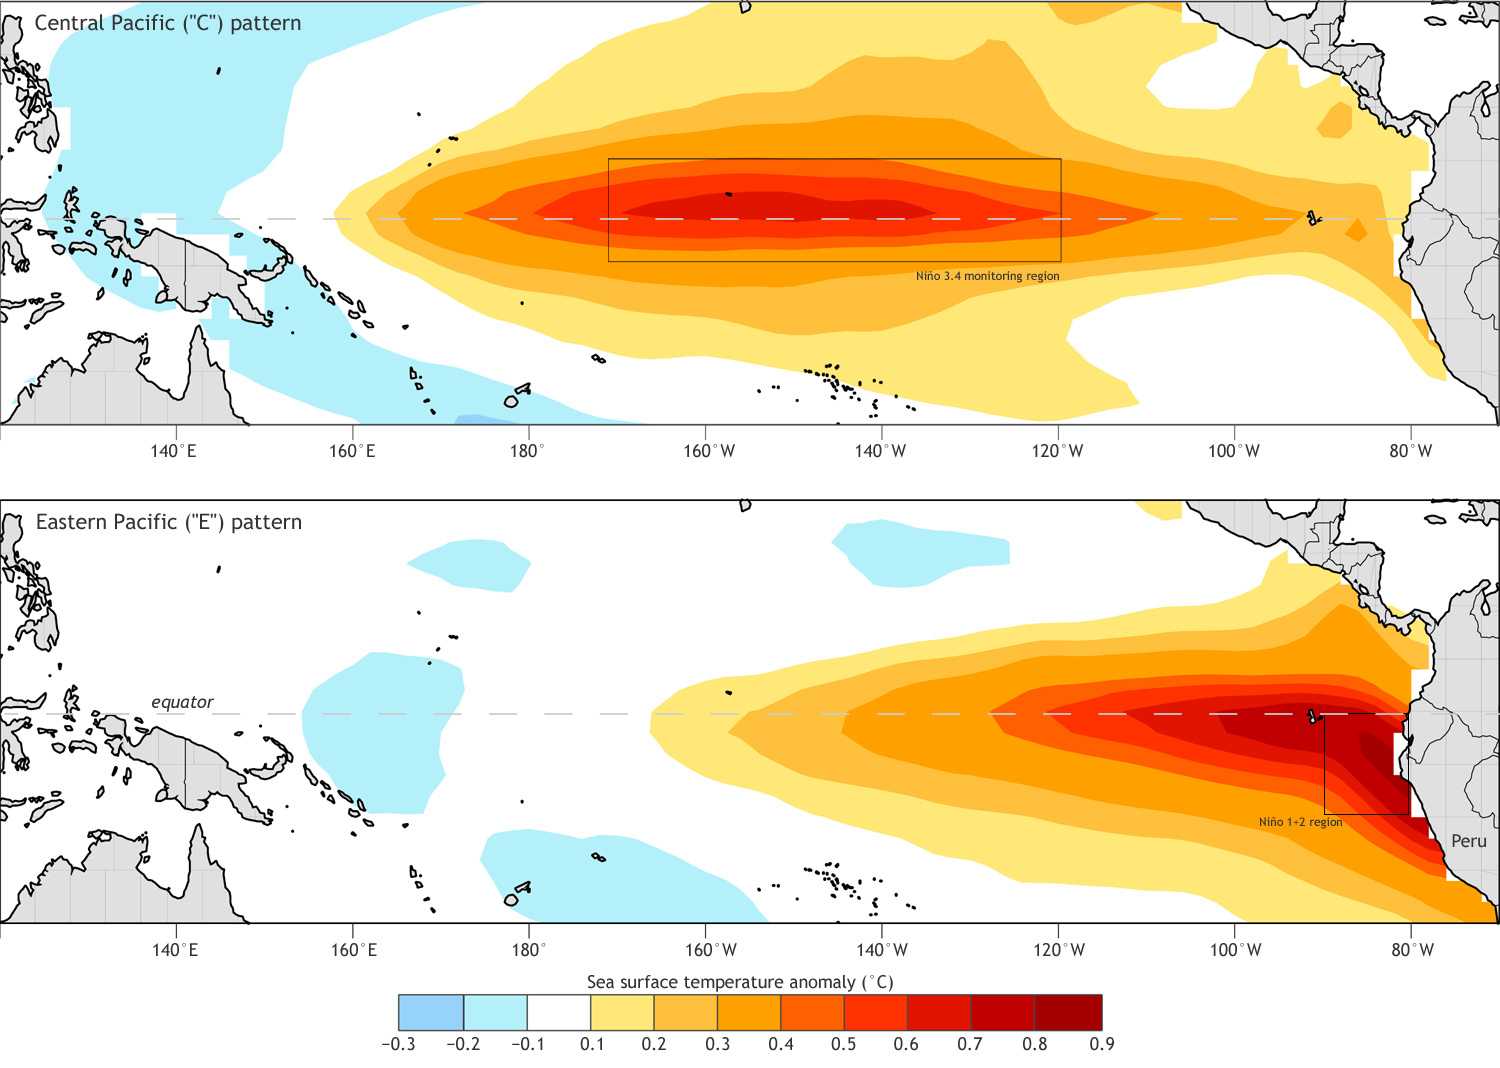
Pattern of sea surface temperature deviation from average (°C) associated with a unit value of the C index (part a) and the E index (part b), based on Takahashi et al., 2011. The Niño 3.4 and 1+2 regions are indicated as dashed boxes in parts (a) and (b), respectively. Most El Niño events can be described as a combination of these two patterns. Image from Ken Takahashi.