
Image caption
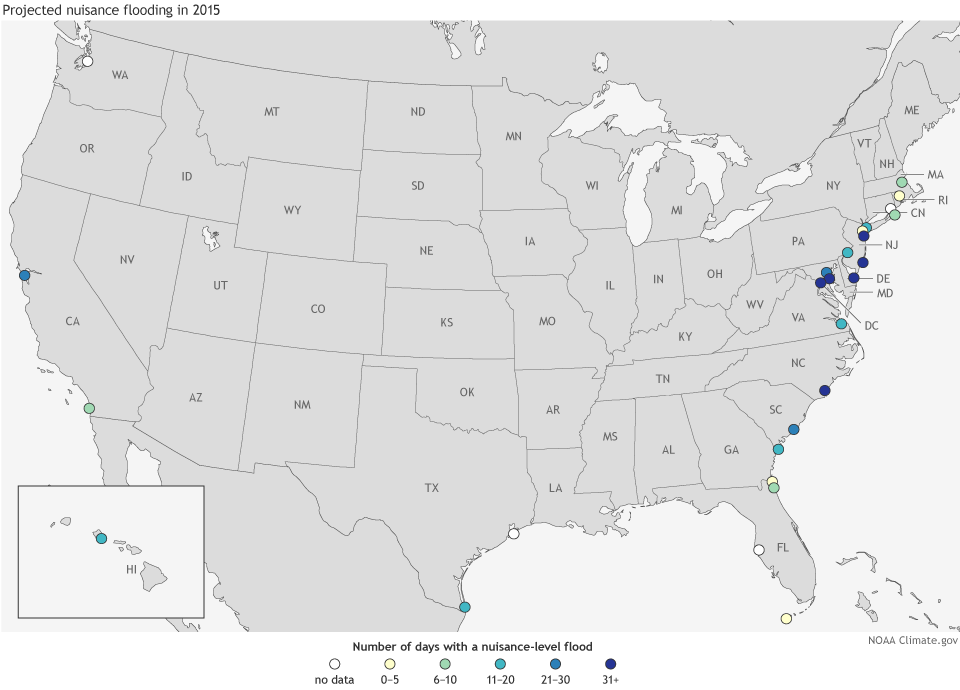
Projected number of nuisance flood days for May 2015-April 2016, based on sea level trends from 1950-2013 combined with influence of El Niño (for locations where historical observations suggests El Niño has an influence on tidal flooding frequency). Map by NOAA Climate.gov, based on data provided by Billy Sweet.