
Image caption
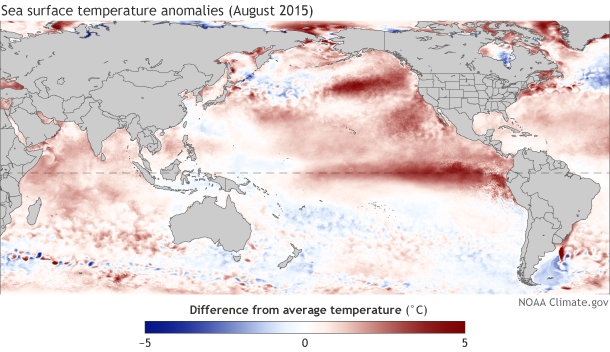
Sea surface temperatures during August compared to the 1981-2010 average. Climate.gov figure, based on data from NOAA View.
Sea surface temperatures during August compared to the 1981-2010 average. Climate.gov figure, based on data from NOAA View.