Image caption
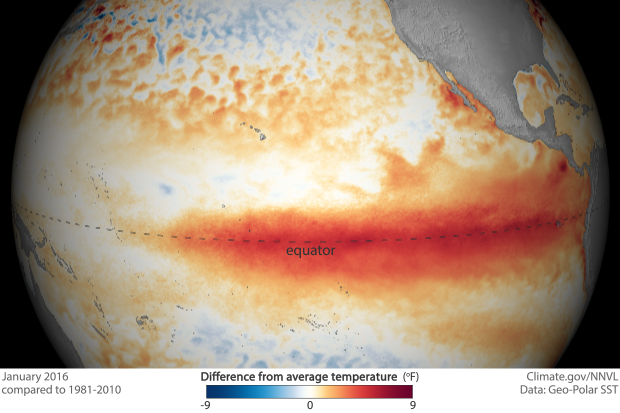
This image shows satellite sea surface temperature departure for the month of January 2015. Colors show where average monthly sea surface temperature was above or below its 1981-2010 average. Blue areas experienced cooler-than-usual sea surface temperatures while areas shown in red were warmer than usual. The darker the color, the larger the difference from the long-term average.