Image caption
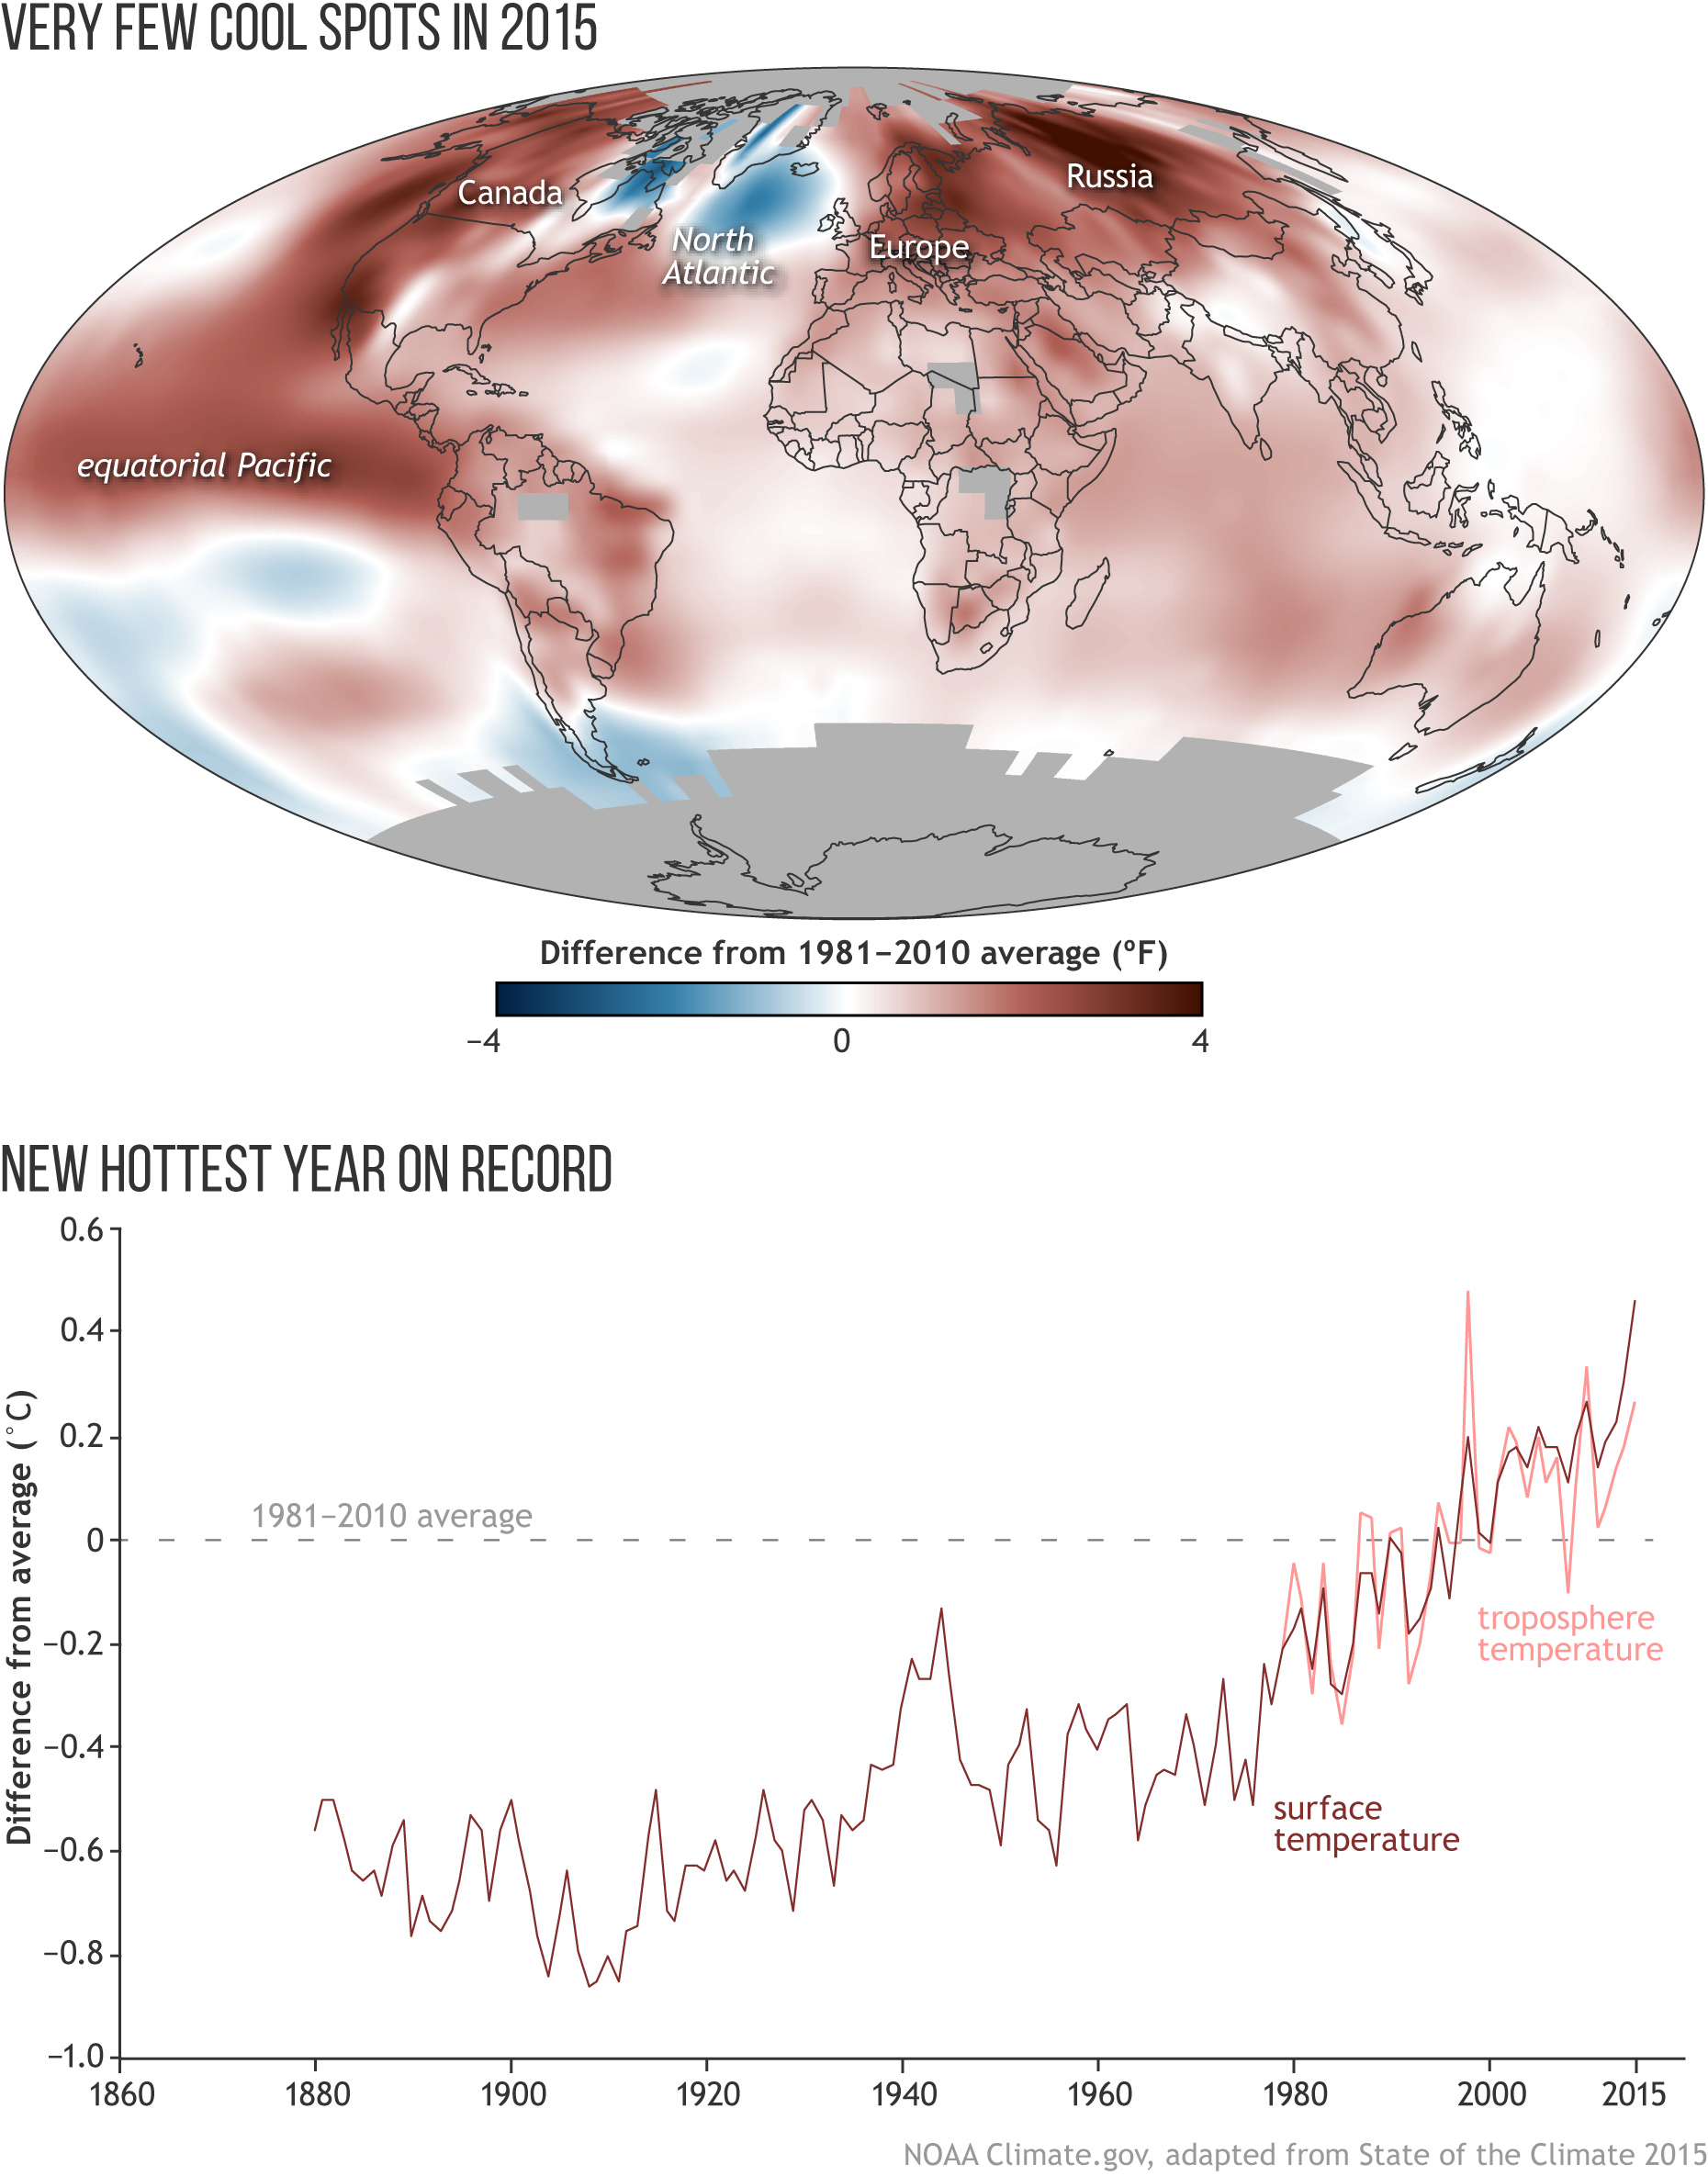
The map shows the average temperature departures for 2015 compared to the 1981-2010 averages. The graph beneath the map shows Earth’s temperature history from 1880 to 2015 compared to the 1981-2010 average (dashed line at zero). Surface temperature is dark red; lower troposphere temperature is light red. (The troposphere is the lowest 10 kilometers [6.2 miles] of the atmosphere.) The 2015 global surface temperature was 0.42oC-0.46oC (0.76°–0.83°F) above the 1980-2010 average, depending on the dataset. Full story.