Image caption
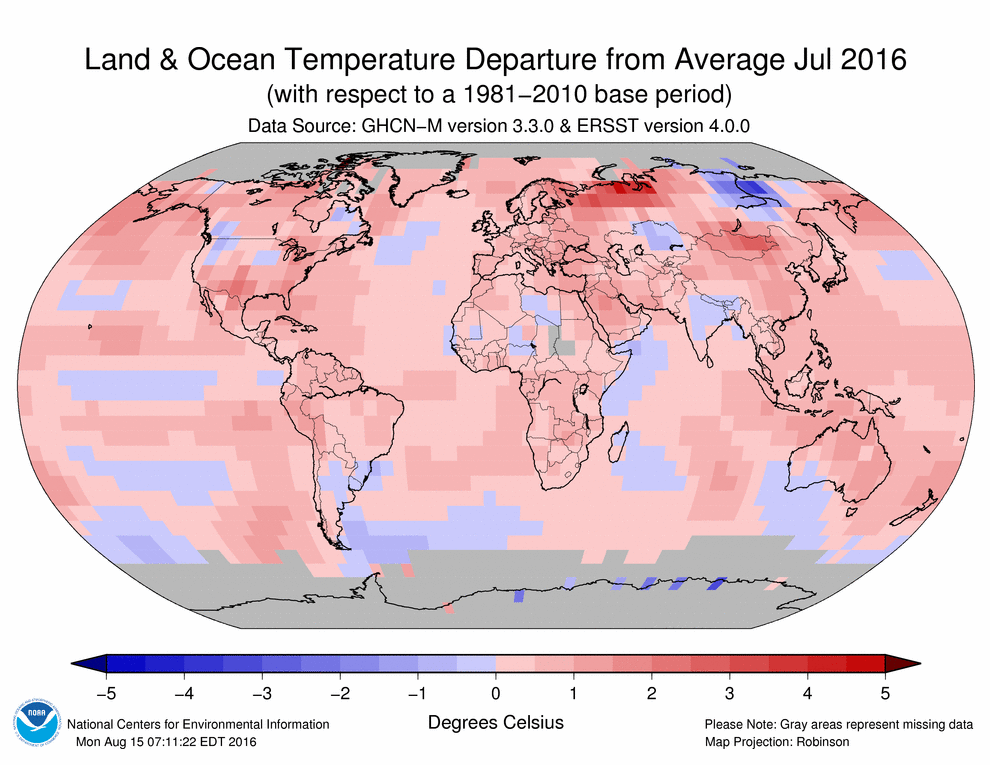
This map shows how surface temperatures, measured by weather stations, buoys and ships, compared to the average of the 1981-2010 period.

This map shows how surface temperatures, measured by weather stations, buoys and ships, compared to the average of the 1981-2010 period.