
Image caption
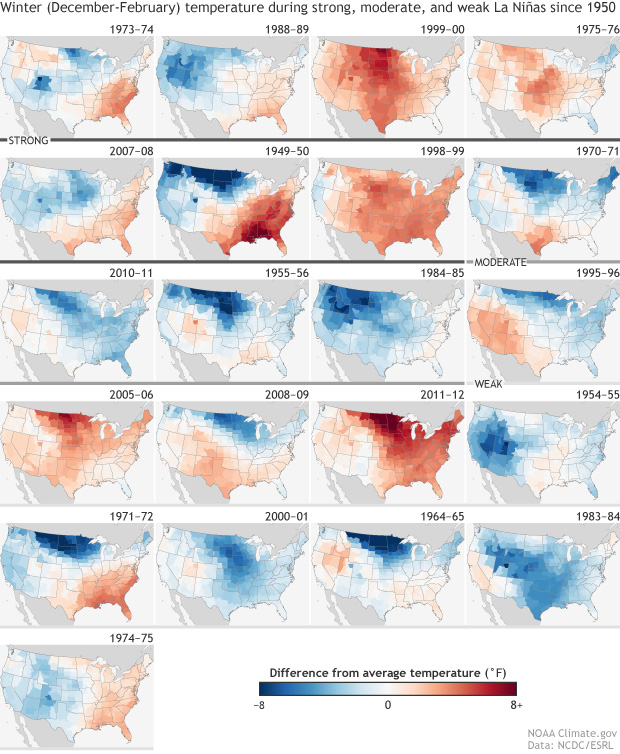
December-February temperatures compared to the 1981-2010 average during each La Niña winter since records began in 1950. Gray lines under the maps indicate event strength: strong (dark gray), moderate (medium gray), and weak (light gray). NOAA Climate.gov image based on climate division data from NOAA ESRL.