
Image caption
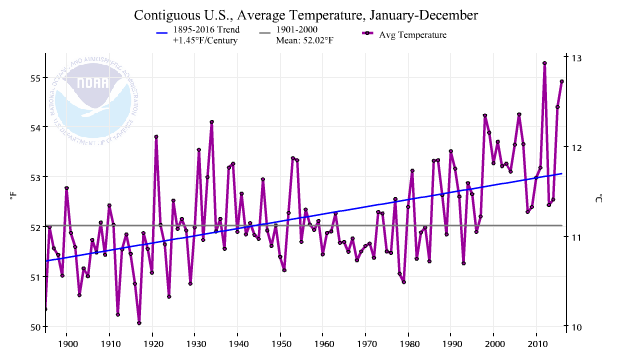
Annual average temperature for the contiguous United States from 1895-2016. Individual years are shown as black dots, connected by a purple line. The linear trend of 1.45°F per century over the period is represented by a straight blue line.