
Image caption
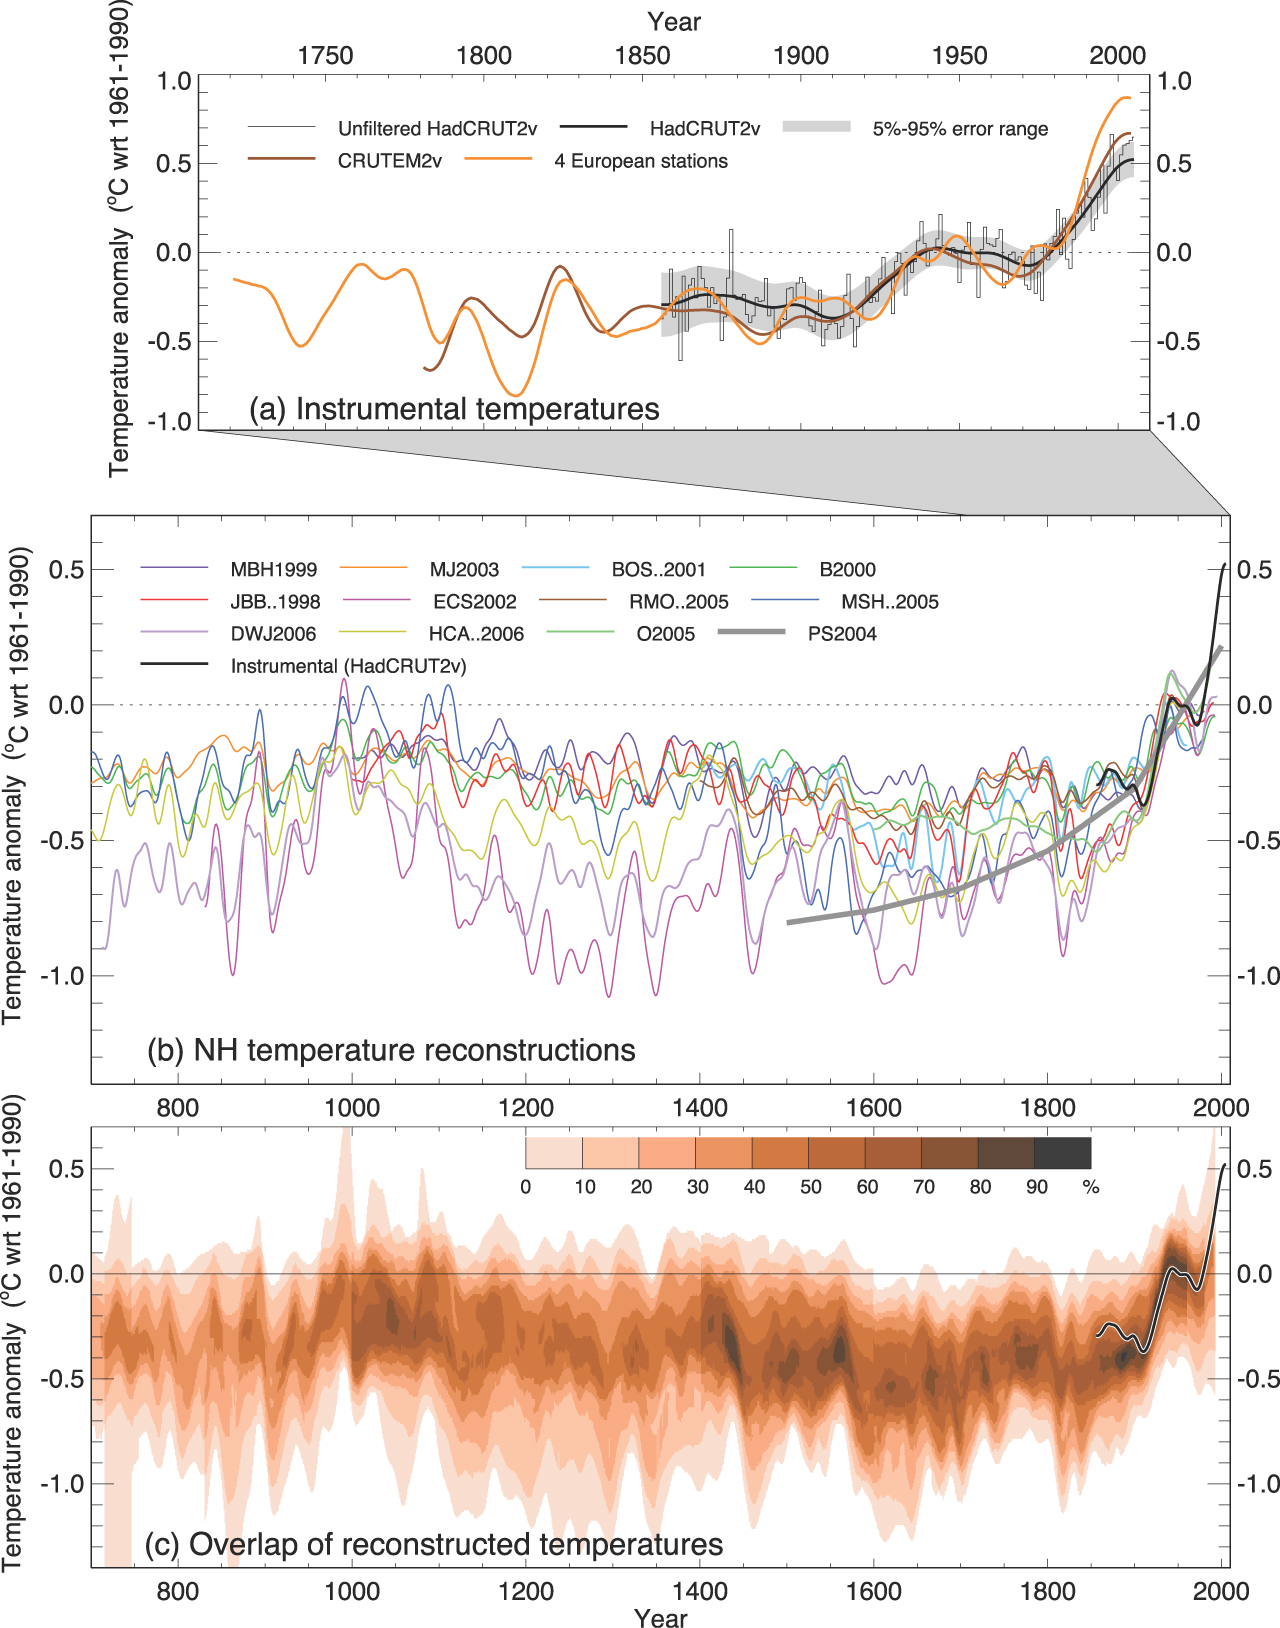
These three graphs show the general agreement of different types of proxy data. The climate history shown here is a reconstruction of temperature in the Northern Hemisphere. Image source: IPCC AR4 WG 1 figure 6.10.
This website is an ARCHIVED version of NOAA Climate.gov as of June 25, 2025.
Content is not being updated or maintained, and some links may no longer work.
These three graphs show the general agreement of different types of proxy data. The climate history shown here is a reconstruction of temperature in the Northern Hemisphere. Image source: IPCC AR4 WG 1 figure 6.10.