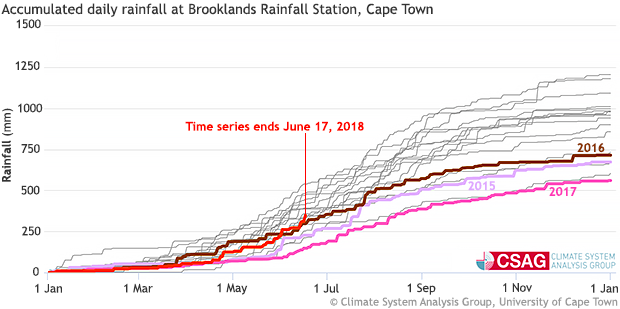
File name: brooklands-rainfall-620.png Original Resolution (pixels): 620 × 309 File Size: 83 KB (MIME Type: image/png) Date Published: June 29, 2018 Alternate Text: Graph shows accumulated daily rainfall throughout the calendar year, with data highlighted for January 1, 2015, through June 17, 2018. View image full size Download file Image caption For 2015 through June 2018, rainfall amounts are color coded by year. Earlier years are gray.
