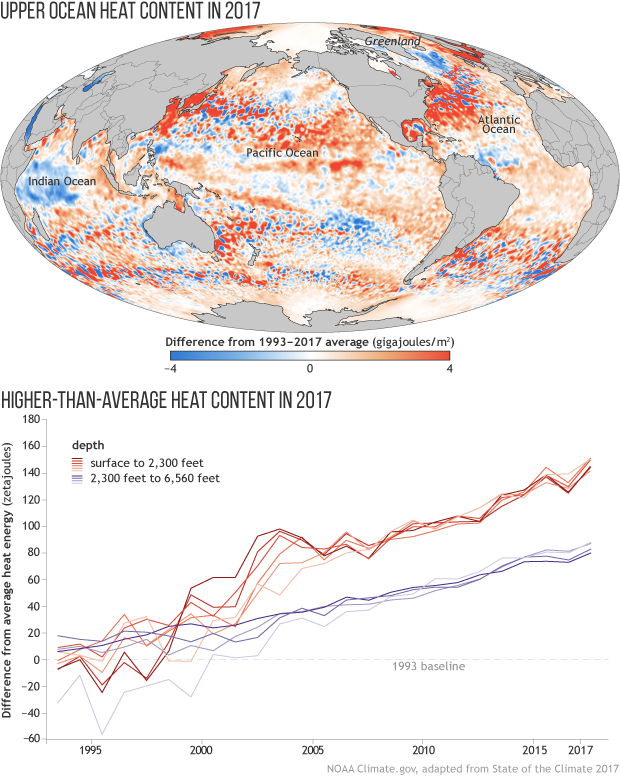
Image caption
Ocean heat content in the global oceans in 2017 compared to the 1993–2017 average. Orange areas are places where heat content was higher than average; blue areas had heat content that was below average. NOAA Climate.gov, adapted from State of the Climate in 2017.