No butterflies, just tropical rainfall
The United States has experienced some intense weather patterns lately, including flooding in California and a Nor’easter in New England. We can’t trace these back to a butterfly flapping its wings on the other side of the world, but we can connect them to tropical rainfall patterns that seem just as far away.
The tropical Pacific and Indian Oceans have some of the warmest oceans temperatures in the world. They provide plenty of heat and humidity for heavy rain and thunderstorms — storms that are so strong they can change global wind patterns and affect weather around the globe. El Niño and La Niña are the best-known examples of how shifts in those rainfall patterns can have global effects. In some years, the warmest water shifts between the eastern and western parts of the Pacific with the rain following right along. The outflow from these thunderstorms at altitudes of around 40,000 feet above the ocean alters the jet stream over the North Pacific, which in turn affects our weather downstream.
El Niño and La Niña drive year-to-year differences in seasonal weather patterns. On the week-to-week scale, the Madden–Julian Oscillation (MJO)—a global-scale pattern in tropical winds and rain (for more on the MJO, see “What is the MJO and why do we care?”)—can be just as important. The MJO’s thunderstorms typically develop over the Indian Ocean and then move eastward to the Pacific over the course of a month or so.
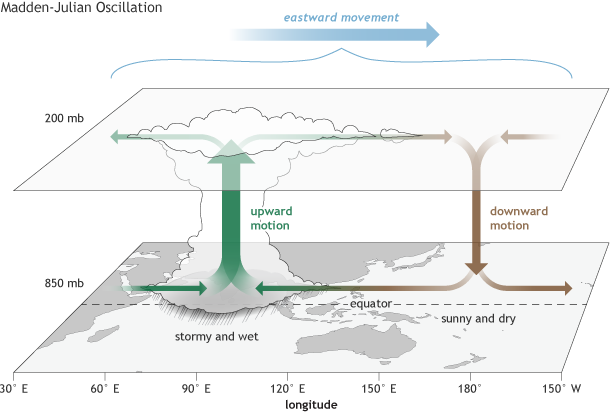
The surface and upper-atmosphere structure of the MJO for a period when the enhanced convective phase (thunderstorm cloud) is centered across the Indian Ocean and the suppressed convective phase is centered over the west-central Pacific Ocean. Horizontal arrows pointing left represent wind departures from average that are easterly, and arrows pointing right represent wind departures from average that are westerly. The entire system shifts eastward over time, eventually circling the globe and returning to its point of origin. Climate.gov drawing by Fiona Martin.
Because the MJO moves around the world in a circle, we find it easier to break its movement into eight phases that each happen about a week apart. The globes below show what a typical MJO would look like in each phase. They show average patterns of outgoing longwave radiation (OLR) for each phase of the MJO, which are usually about a week apart. Tall thunderheads block the earth’s heat from radiating into space, so OLR is an easy way to measure the strength of those storms. In other words, when a satellite sees much less heat radiating from Earth’s surface than usual—especially in a place as warm as the tropics—it’s a good sign that a towering thunderstorm cloud is blocking the satellite’s view.
Averages of all January–March MJO events from 1979–2016. Green shading shows below-average OLR (outgoing longwave radiation, or heat energy) values, indicating more clouds and rainfall, and brown shading identifies above-average OLR (drier and clearer skies than normal). The purple contours show the location and strength of the Pacific jet at the 200-hPa level (roughly 38,000 feet at that location). Note the eastward movement of the wet and dry areas. How far the Pacific jet extends past the international dateline also changes with the phase of the MJO. NOAA Climate.gov animation, adapted from original images provided by Carl Schreck.
In Phase 1, high values of OLR, suggesting dry and clear conditions, dominate a region we call the “Maritime Continent”: the thousands of islands and peninsulas that make up Indonesia, Malaysia, Australia, Papua New Guinea, and southeast Asia. Meanwhile low OLR values, suggesting clouds and rain, begin to develop over the Indian Ocean. In Phases 2 and 3, those wet signals over the Indian Ocean grow while the dry signal wanes and retreats eastward to the western Pacific.
During Phases 4 and 5, the wet areas shift eastward into the Maritime Continent. As the dry signal shrinks over the western Pacific in Phase 4, it races around the Western Hemisphere and reemerges in the Indian Ocean in Phase 5. Because the wet and dry areas are always chasing each other around the globe, Phases 1–4 look like mirror images of Phases 5–8 with the wet and dry areas flipped.
The Maritime Continent in Phases 4 and 5 is one of the most critical regions in the MJO’s entire lifecycle. All the countless islands, mountains, and seas wreak havoc with the MJO’s thunderstorms. Even our best weather models struggle to predict the complex interactions between the MJO and all that terrain. It’s also a place where the MJO has some of its biggest effects on the United States. The length and speed of the Pacific Jet (purple shading) ebbs and flows with the MJO. It tends to be weakest and shortest when the MJO’s rainfall is in the Indian Ocean. Then it strengthens and lengthens and the MJO moves eastward to the Maritime Continent. These fluctuations affect our weather patterns downstream.
In recent weeks, a particularly strong MJO event has been making this loop. When the MJO is over the Maritime Continent, as it was in late January/early February, the outflow from its thunderstorms feeds the Pacific jet and helps it stay straighter and longer between Asia and North America. Notice in the maps below how the jet (shown by the purple blob) extends all the way to California as the MJO approaches the Maritime Continent 19–25 January.
This stronger jet can make “atmospheric rivers” stronger and more frequent along the West Coast. Like a real river flowing downhill, these atmospheric rivers use the jet to draw water in the atmosphere from the tropics up to the mid-latitudes. These atmospheric rivers provided the moisture for the heavy rain and snow in California in late January and February.

Clouds and wind patterns for the MJO event that occurred from late-January to mid-February 2017. Black contours highlight the OLR signals directly associated with the MJO. NOAA Climate.gov images adapted from originals by Carl Schreck.
The MJO also affects the jet stream over the United States. When the MJO is over the Maritime Continent, the jet typically bends northward over the western part of the country and southward to east. That configuration leads to unseasonably warm temperatures in in the west and cool temperatures in the east. As the MJO moves eastward into the Pacific, the Pacific jet weakens and the pattern over the United States flips.
Forecasters have become increasingly aware of the MJO’s influence. Meteorologists in the financial and energy sectors use the MJO’s impacts to forecast natural gas prices (see Schreck et al. 2015). Forecasters for the National Weather Service in Boston/Taunton, MA, also relied on MJO information to predict the recent series of snowstorms in New England. Here’s part of their forecast discussion from February 11, 2017 (emphasis mine):
Snow lovers rejoice, this is your week. Several signals that support pronounced troughing over the NE CONUS through mid-February: (1) MJO presently in phase 7 transitioning into phase 8 as H5 high pressure over the W Pacific strengthens up against a dominant H5 low in the vicinity of the Aleutians. Subsequently the Pacific jet is enhanced with dominant SW-flow into the W CONUS promoting a +PNA. Work done by others, for example, Klotzbach et al. (2016), show that in such MJO phasing there is both the promotion of deeper troughing. Lower MSLP, more amplified storm track over the NE CONUS thus an increased probability of snowfall events over SE New England given enhanced moisture and greater baroclinicity per energy out of the SW and cold air advection out of the N/NW, and a negative phase of the NAO. It`s not entirely clear but the signals are there.
The Phase 7 and 8 that the forecaster references mean that the MJO is moving through the central Pacific (see Figure 1). In the paper referenced in the forecast (Klotzbach et al. 2016), my colleagues and I used several NCEI datasets to detect a link between the MJO and these types of snowstorms. One of those datasets is the 20th Century Reanalysis that uses a computer model to estimate the full atmosphere from observations of sea-level pressure that are archived at NCEI and elsewhere. From the reanalysis, we could track the MJO back to the early 1900s. We also identified low-pressure systems like Nor’easters and counted them for each phase of the MJO.
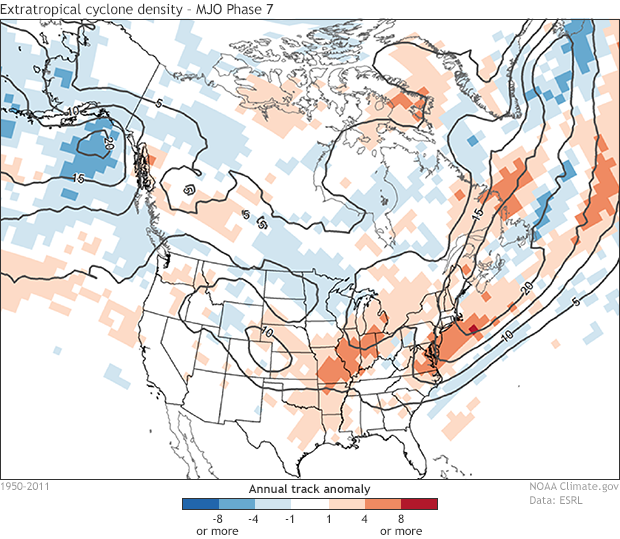
Number of low-pressure systems passing within ~500 miles (750 km) of each point during all MJOs in Phase 7 from 1950–2011. Red and blue shading show how many more storms passed through each point in Phase 7 compared to the average for all eight phases. NOAA Climate.gov image adapted from original by Carl Schreck.
The map above shows the total number of storms that passed through each region during phase 7 (defined by black contours) and how many more (red) or less (blue) compared with the average for all phases. The East Coast of the United States is fertile ground for low-pressure systems that feed off the differences in temperature between the cold landmass and the warm Gulf Stream. This figure shows that they become even more common when the MJO is in the western Pacific.
We also used NCEI’s records of daily snowfall back to 1936 for eight stations in southern New England. They counted how many days were snowy in each phase of the MJO, and again showed that snow days were up to 15% more likely during phase 7 than in other phases.
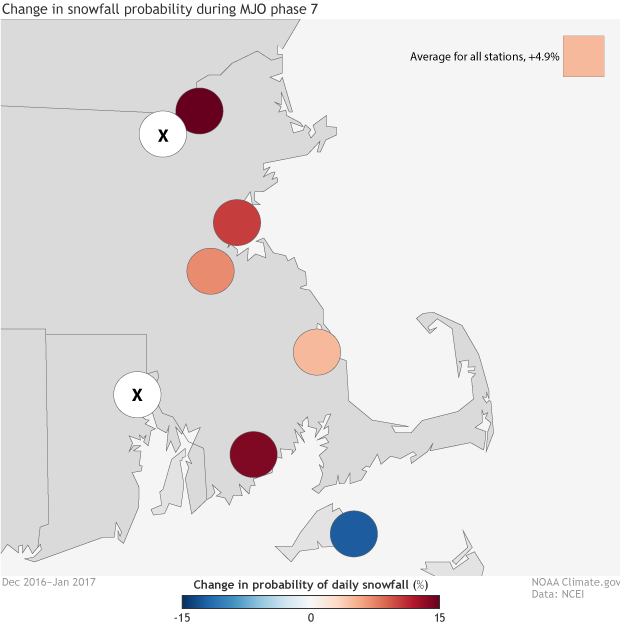
Change in daily snowfall probability in southern New England during Phase 7 of the Madden-Julian Oscillation. The mean increase in probability is nearly 5% (pink square in the upper right). NOAA Climate.gov image adapted from original by Carl Schreck.
Of course, the National Weather Service wasn’t basing their forecast on the MJO alone. They use sophisticated computer models that approximate the laws of physics to predict how all these weather systems interact. Year after year, however, the human meteorologists beat the forecast skill of those models, in part because they use their knowledge and experience with systems like the MJO to know when to trust the models. This time, the models and other factors like the MJO were all pointing to snow, which gave the meteorologists confidence to make the right forecast. It snowed in Boston four of the next five days after that forecast was issued. All told, Boston got 20.7” of snow from 7–16 February. Whether they were rejoicing or grumbling about the snow, New Englanders probably have the MJO to thank (blame) for at least some of it!
Comments
Great Article!!
RE: Great Article!!
Comments have been disabled on this article