Problem child: sometimes snow data need extra love
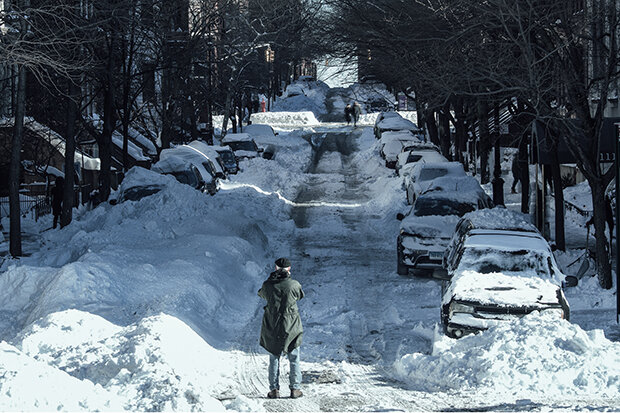
It’s early February, and many of us just dug out—literally and figuratively—from the blizzard of January 2016. We got 6-12 inches here in Asheville; the totals varied from mountain to mountain, like they always do. The snowstorm also buried me under 25 feet of snow-related paper, and that’s what inspired this week’s blog.
Putting today’s big weather events into perspective is one of our responsibilities here at NCEI. People and businesses are naturally curious about whether today’s Big Event is dwarfed by history, repeats history, or makes history. This helps us map it out in our minds and in our strategic plans, and that helps shape our actions going forward.
We need data to objectively describe that history. Cleaner data helps us do it more accurately.
Similarly, one criterion to determine if Federal disaster assistance is appropriate is how a snowstorm stacks up to history. If snow totals fell within a certain percentage of the all-time record one-, two-, or three-day event, then - pending some other factors - a disaster declaration may follow.
That’s what sent me into our 25-foot-high stacks of historical paper observer forms.
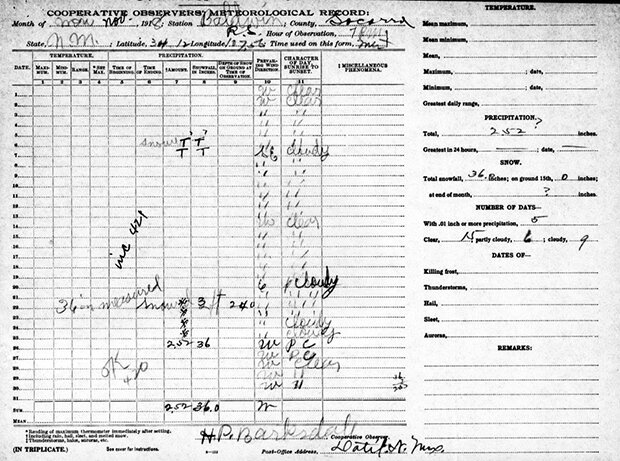
A cooperative observer form for November 1918 at Datil, New Mexico. A large snowstorm beginning on the 22nd prevented the observer from making a proper measurement until the 26th. The five-day accumulation of 36 inches of snow and the liquid equivalent (melted snow) of 2.52" were transcribed in subsequent years as one-day values. An examination of the paper copy corrected the record. Photo by Deke Arndt, NCEI.
I’ve worked with weather and climate data almost every day for a quarter century now—long enough to get weird(er). After so many years, I appreciate each variable’s unique “personality.”
If weather observation types were kids in a classroom, temperature would be the Teacher’s Pet. Temperature data is clean, it shows up every day, it gets along with the other kids. Data issues are typically minor and straightforward, hey-tuck-in-your-shirt kinds of issues. When issues are large, there’s usually a clear path to understanding why.
Rainfall is the kid you underestimate. Literally. The instruments to measure rainfall occasionally fall a bit short of what actually happened.
Wind and Pressure are those kids you wished you’d paid more attention to. Where did the time go?
Snow observations can be a little, um, flaky. Show-up-at-the-wrong-school flaky. They’re kind of messy. Instead of hey-tuck-in-your-shirt, it’s hey-put-your-shirt on, followed by no-your-arms-go-in-the-arm-holes.
But, like any schoolkid, once you get past the maddening distractions, there are moments of clarity and excellence that are truly rewarding. That seemingly impossible snow total you didn’t believe at first? It may be evidence of some really interesting local meteorology: a plume off of a warm lake, or a band that set up over just a few counties.
What makes snow data so challenging?
Going Beyond the Data, the factors that make snow data challenging are the same ones that make snow itself challenging.
(1) Snow impacts us in three distinct ways, so we measure it in three ways. Temperature is straightforward. 73 degrees is 73 degrees, no matter how you measure it. Rainfall is straightforward. If we know rainfall rates and amounts, we can figure out how gravity and land features will move the water. But snow is a special type of precipitation that impacts us in three phases.
- In an immediate practical sense, we need to know how much new snow has fallen to decide whether we need to take some kind of action - often involving plows and shovels and - at my house, anyway - a less-than-enthused teenager. So new snowfall is one of our three snow variables.
- Snow also piles up over time, and one day’s snowfall can get added to the previous day’s. It’s not enough to know how much new snow fell. We also need to know how deep the snow is out there. Is some of it melting? Compacting? To address these questions, we track snow depth.
- Finally, snow ultimately melts. Knowing how much water it will make upon melting is important for understanding how it will affect soils and streams. Observers track this aspect by melting the newly fallen snow, and recording this “liquid equivalent” as precipitation.
Observers recognized these three aspects early on, so we measure snow three ways, with three different precisions: snow depth to the inch; snowfall to the tenth of an inch; precipitation to the hundredth of an inch. Measuring the same thing three ways can set you up for old-fashioned clerical mistakes, often compounded by the next item on our list.
(2) Snow is relatively rare. With few exceptions, most places, even northern places, only see snowfall during certain months of the year. Only a fraction of days during those months actually produce snow. Those of us in the South can go months or even years between snow events (please keep your Southerners-driving-in-the-snow jokes to yourself). Observers don’t get to practice recording snow events every day like they do for temperature.
(3) Snow’s large variability is one of its hallmarks. Where temperature is well-behaved in this aspect--the temperature at one station is very likely to in the same ballpark as the temperature at a station a half-mile away, at least if they are at similar elevation--snow can be all over the map, all over the map. The combination of the following two factors makes spatial intercomparison (“buddy checking” against neighboring stations) really challenging.
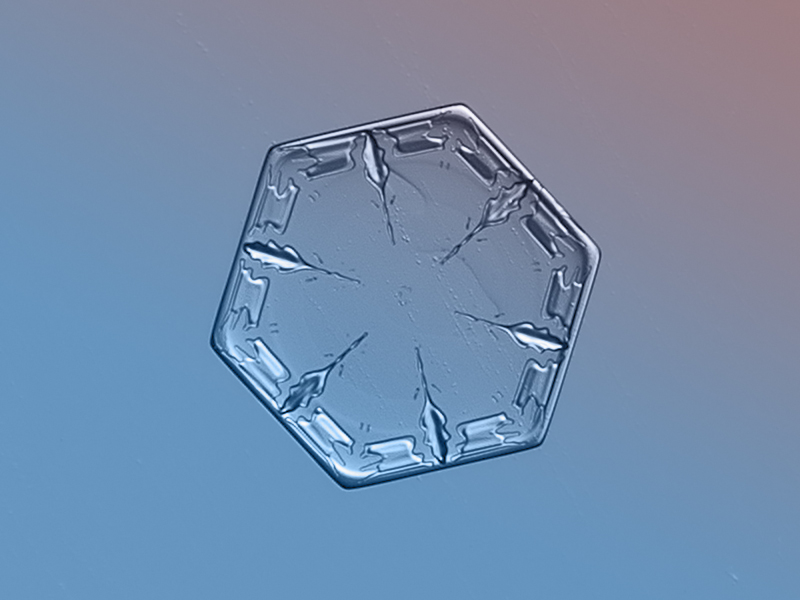
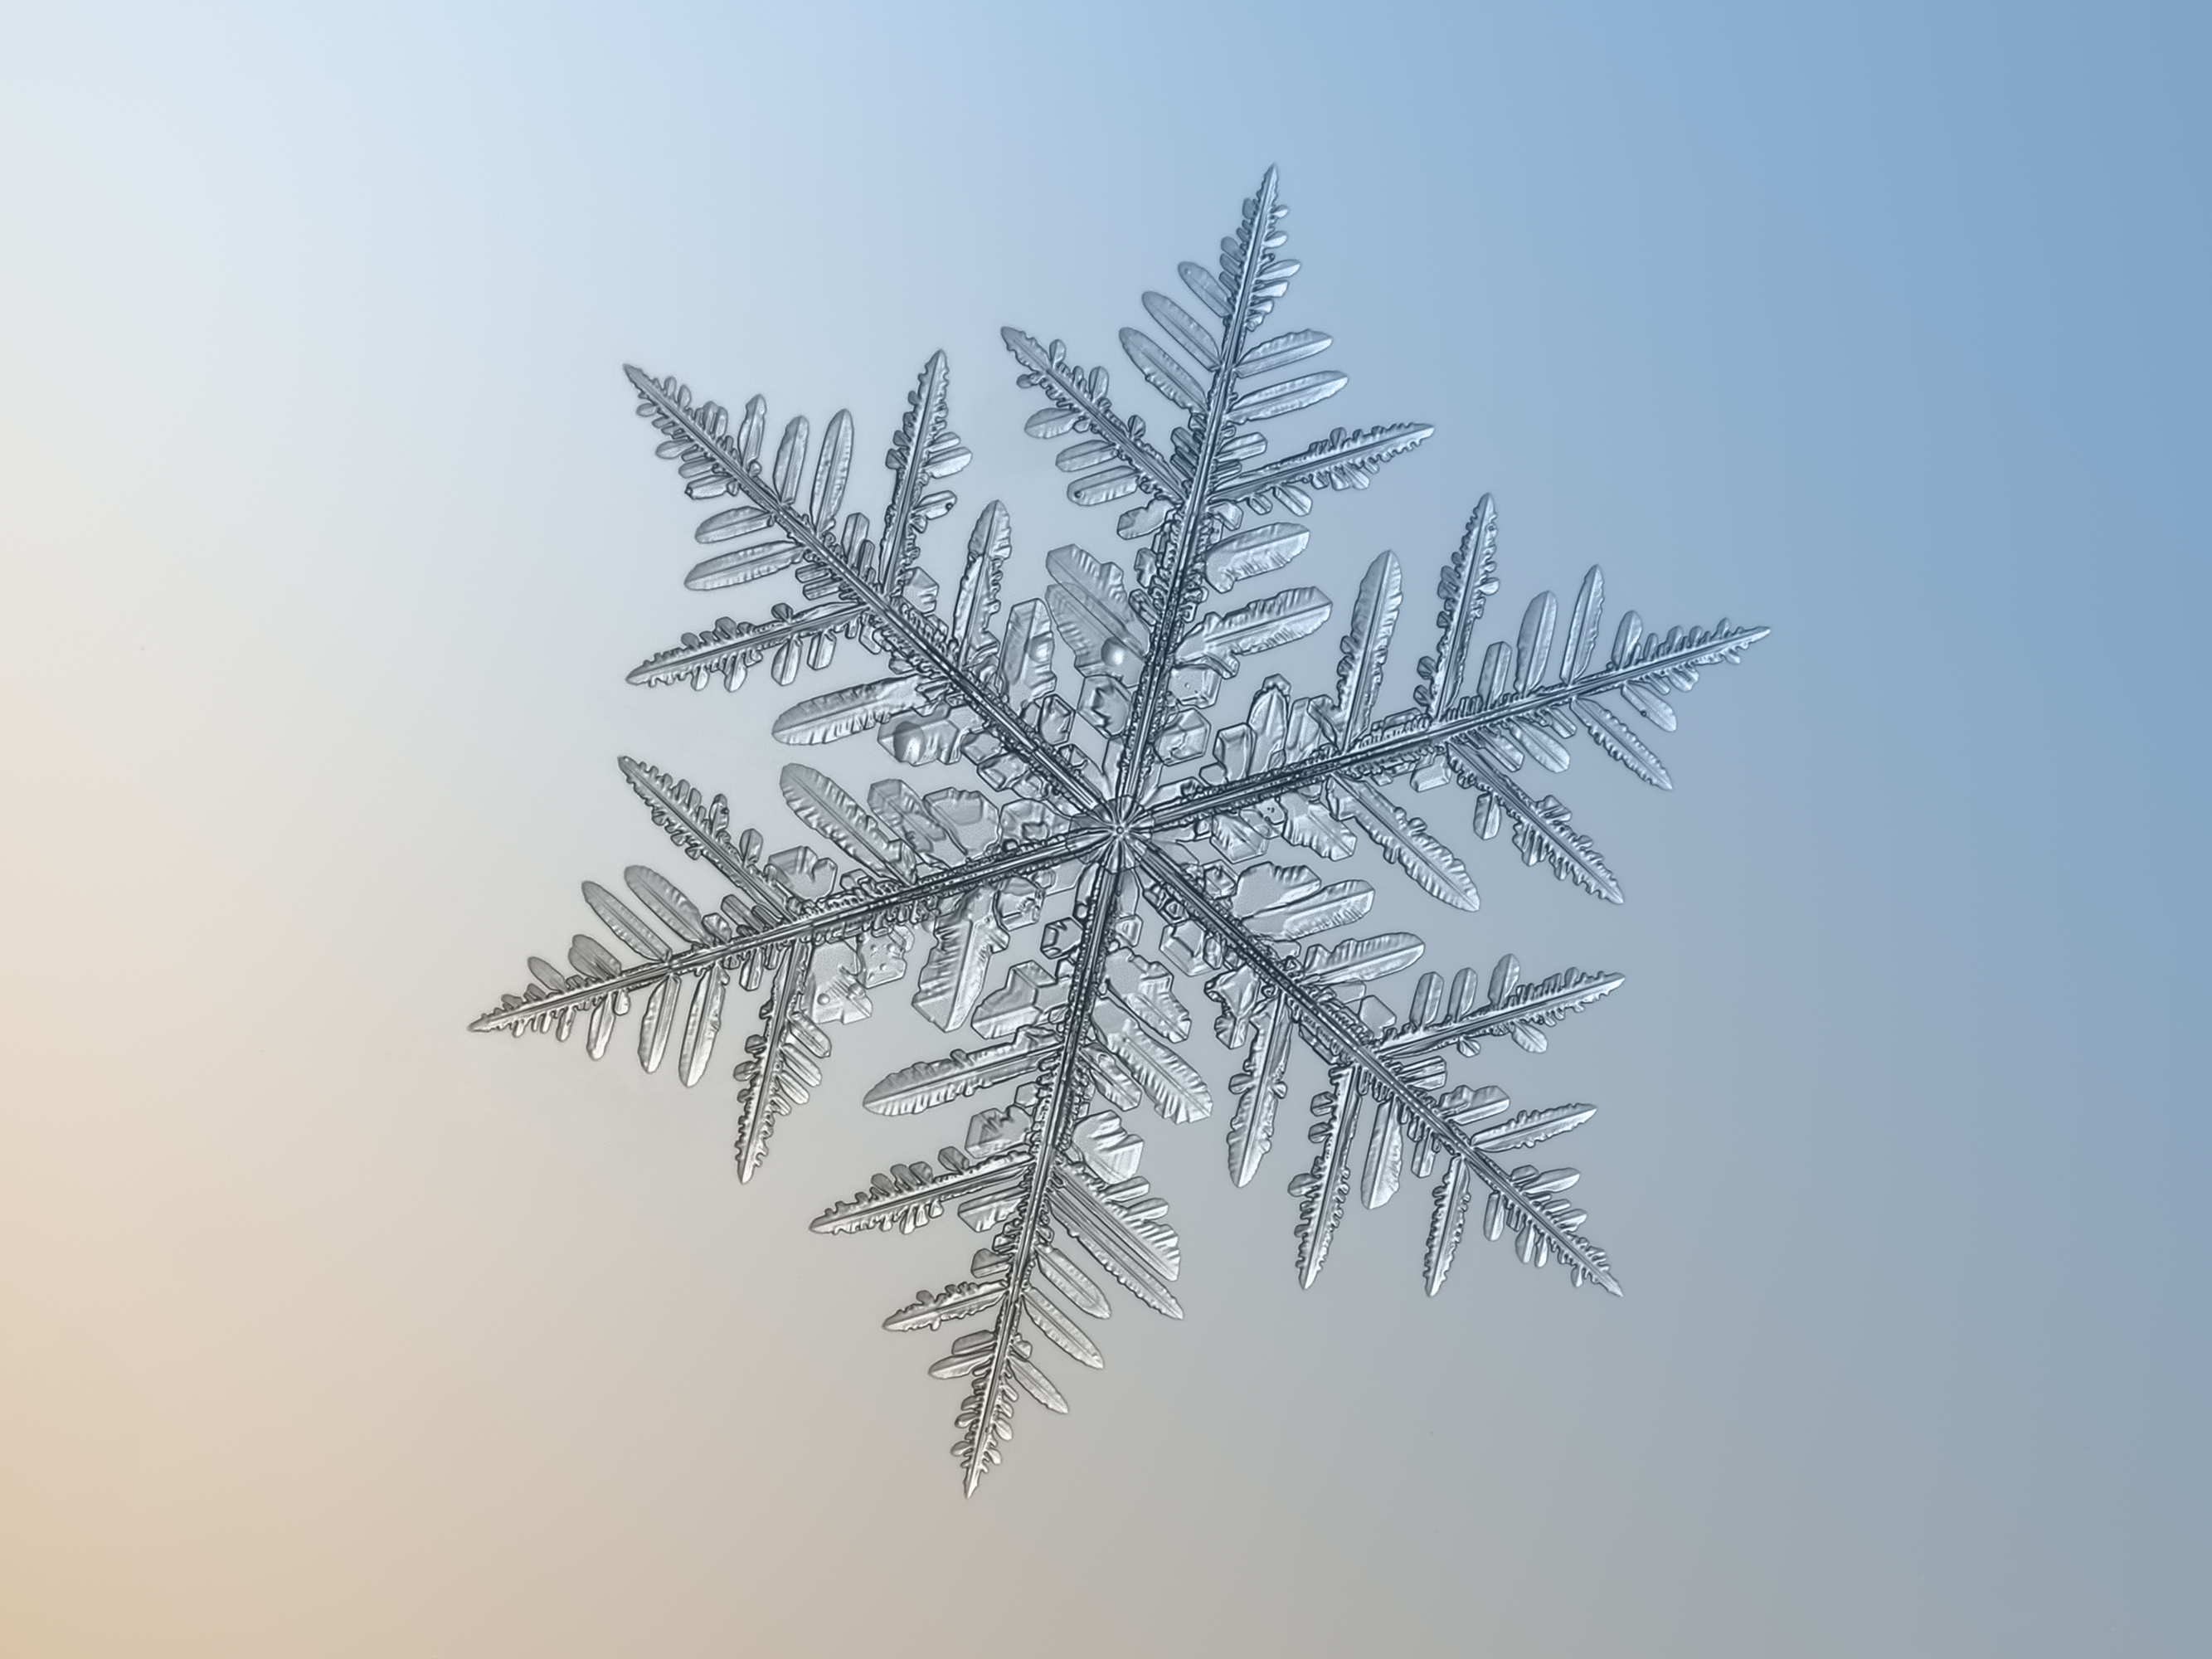
- Snow can be wildly inconsistent in character. It’s one of the cardinal pieces of weather mythology: no two snowflakes are alike. Obviously, there are some inifinity issues with a statement that absolute, but the gist of it holds: snowflakes can take on an near-endless combination of shapes and sizes. They can be beautifully and extravagantly dendritic, or not-so-beautifully needle-shaped, or humble plates, or workmanlike crystals, and all kinds of in between. These different snow “habits” arise from tiny temperature and moisture variations as they form. Going from the snowflake scale to the snowstorm scale, these tiny atmospheric variations can account for wildly different types of snow accumulation. One ten-inch storm may produce wispy, dry snow that melts down dramatically from ten inches to half an inch of water. Another ten-inch storm may deliver heavy, rich, dense snow that compacts as it lands, and may melt down into an inch-and-a-half of water.
- Snow can also be wildly inconsistent from place to place, even in the same storm. A well-placed slot of dry air, or moist air, or small features in the jet stream above can produce localized bands of much heavier or lighter snow. Or they can produce localized bands of very different-in-character snow.

(4) Finally, and sorry kids, you’ll know when you’re my age, it’s miserable to work in snow. Its occurrence actually impedes observations. Nobody works particularly well when it’s cold and wet. Sometimes it’s not safe to work when there’s a foot of snow on the ground. For an observer in South Dakota, iced in after a blizzard, sometimes that daily snow observation will just have to wait until tomorrow, which makes it a two-day accumulation, which makes the observation an apple in a basket of oranges. It happens.
Consider all of these things together. Historically, snow observations were written by hand, in columns, on paper spreadsheets like the one above, with different precisions, for different aspects, by someone who was probably cold and wet, and didn’t do this too often, then transcribed into digital data years later, by someone the observer never met. Add to this how challenging it is for computers to buddy-check a snow observation. It’s easy to see how there may be some issues hiding within the historical data we compare to today’s snow totals.
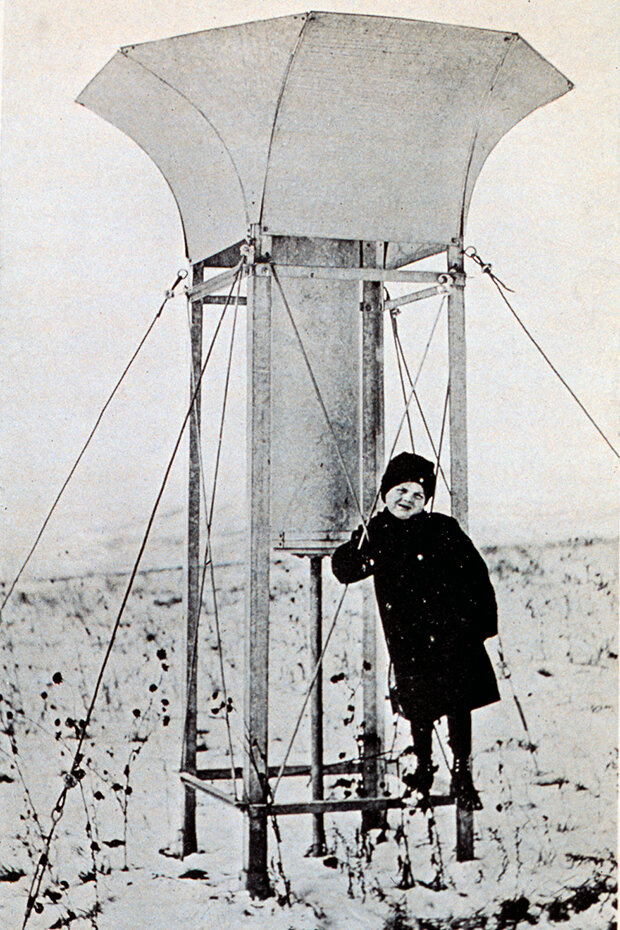
Shielded snow gauge in the Northwest to register snowfall. In: "The Boy with the U.S. Weather Men", 1917, p. 224. Image from the NOAA Photo Library.
If you’ve concluded that checking out large historical snow observations is a laborious and hands-on process, you’re right! But it needs to be done, and it is done here at NCEI. Sometimes, it means walking into our stacks, pulling a specific piece of paper filled out 75 years ago, by someone long since gone, and verifying that the 15 inches of snow in our electronic data was really written as “15.0” - or finding it was written as “1.50”. An automated algorithm considering seven inches at a neighboring site would be at peace with either value. Sometimes the best quality assurance method involves shoe-leather and warehouse dust.
Finally, if sifting through records by hand sounds enjoyable, welcome to a small club of weird data scientists, some of whom assign personalities to data types. And tuck your shirt in.