Thomas Jefferson and the telegraph: highlights of the U.S. weather observer program
The winter average contiguous U.S. temperature was 1.8°F above average, ranking among the warmest third of the record since 1895. In February record-setting precipitation was observed across the mid- and lower-Mississippi Valley, the Midwest and Northern Rockies. During April, the average contiguous U.S. temperature was 48.9°F, 2.2°F below the 20th century average, making it the 13th coldest April on record and the coldest since 1997.
Average (1981-2010) April temperatures across the contiguous United States compared to April 2018. NOAA Climate.gov maps from the Data Snapshots collection, based on NCEI data.
These are some recent statistics provided by NOAA’s climate monitoring program at the National Centers for Environmental Information (NCEI) and are part of the hundreds of climate reports that NCEI has produced in recent decades. Many businesses, state and local governments, and people across the country have come to rely on the authoritative information and climate perspectives provided in these monthly reports.
With a climate record stretching back to the 1800s, questions are asked from time to time. How did NCEI come to have an almost 125-year record of the nation’s climate? Where do the data come from and who had the foresight to begin collecting and preserving observations so many years ago?
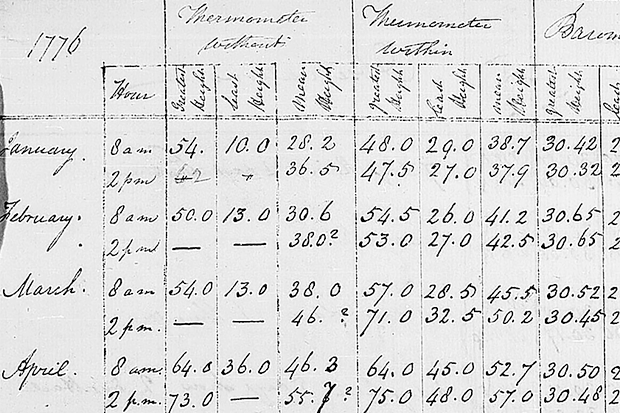
Thomas Jefferson's weather log book with observations from 1776 are part of the U.S. historical climate record. NOAA photo courtesy Jason Cooper.
The earliest known systematic weather observations in America were taken by John Campanius Holm along the Delaware River in the 1640s. Some of our earliest presidents also were avid weather observers. Thomas Jefferson bought his first thermometer while writing the Declaration of Independence, and purchased his first barometer a few days following the signing of the document. Jefferson maintained an almost unbroken record of weather observations until 1816. George Washington also took regular observations; the last weather entry in his diary was made the day before he died.
During the early and mid-1800's, weather observation networks began to grow and expand across the United States. The Surgeon-General of the Army issued a directive to his Army surgeons in 1818 to record the weather and everything of importance relating to the medical topography of his station, the climate, and diseases prevalent in the vicinity. This was to help determine if there was a cause and effect relationship between climate and the health of the soldiers and to determine the occurrence of any change in the climate of a given district over time.
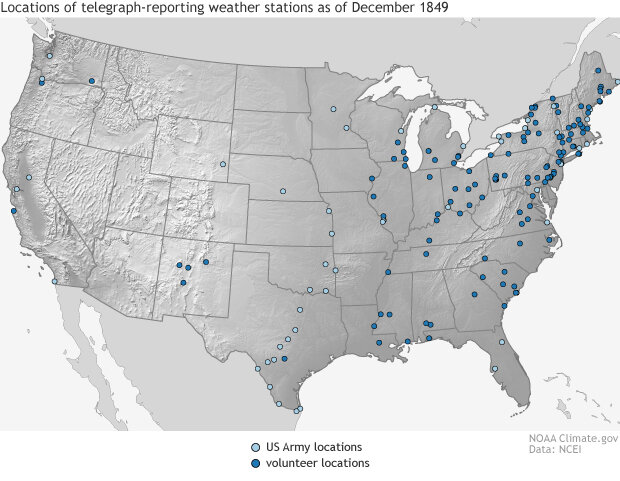
The invention of the telegraph provided the first opportunity to operational meteorology in the United States, with more than a hundred stations relaying weather observations back to the Smithsonian Institution. NOAA Climate.gov map, based on historical data from NCEI.
The ability to share observations was greatly aided by the advent of the telegraph, which enabled weather observations from distant points to be rapidly collected, plotted and analyzed at one location. When the telegraph became operational in 1845, visionaries saw the possibility of forecasting storms simply by telegraphing ahead what was coming. Volunteer observers were recruited across the country via a circular distributed by the press. By the end of 1849, more than 100 volunteers throughout the United States were regularly reporting weather observations, at that time to the recently established Smithsonian Institution. By 1860, several hundred stations were furnishing daily telegraphic weather reports to the Washington Evening Star.
In the years following the Civil War the need to warn mariners of impending storms led Congress in 1870 to authorize the Secretary of War to take observations at military stations and to warn of storms on the Great Lakes and on the Atlantic and Gulf Coasts. This service was extended in 1872 throughout the entire United States, for the benefit of commerce and agriculture. The agency born under the Army’s Signal Service would in later years be known as the Weather Bureau and then as it is known today, NOAA’s National Weather Service.
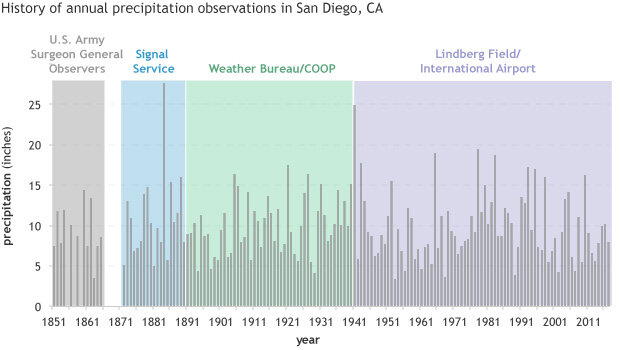
The long-term record of precipitation in San Diego, California, comes from different observer programs. The earliest observations were made by the U.S. Army; the most recent ones come from the city's airport. NOAA Climate.gov graphic, based on NCEI data from Jaw Lawrimore.
The number of Signal Service stations grew from 24 in 1870 to 284 in 1878. At least three observations were taken each day, morning, afternoon and night; of barometric pressure, temperature, precipitation, relative humidity, winds, clouds and state of the weather. Weather observations and forecasts remained within the War Department until 1890 when Congress transferred this responsibility to a civilian Weather Bureau under the Department of Agriculture, a recognition of the importance of weather to the nation’s growing commerce and agricultural sectors.
This is where our modern record and the ability to provide historical perspective begins in earnest. In the same year Congress established the Cooperative Observer Program (COOP). For more than 120 years this program has enlisted volunteers from across the country to take daily observations of temperature, precipitation, snow, and in some cases evaporation and soil temperature. By 1895 there were more than 2000 COOP stations covering all parts of the contiguous U.S., even in parts of the country that were not yet states.
For more than 120 years, participants in the U.S. Cooperative Observer Program (COOP) have supplied daily weather data to the nation. This animation shows the locations of observers each decade from 1890-2009. As far back as the 1890s, there were stations in places as remote as Hawaii and Alaska. NOAA Climate.gov animation, based on data from NCEI.
There have been changes in the program over the years, but one thing that has remained constant is the dependence on volunteer observers. In many families the responsibility for supporting the nation’s climate record has been passed from one generation to the next. Today each of the 122 Weather Forecast Offices (WFO) in all 50 states and U.S. territories maintains a continuing program of COOP observer recruitment, training, and provision of instruments and maintenance.
Until the 1990s observers recorded each day’s observations on a paper form and mailed them to their respective WFO at the end of each month, where they were collected and sent on to NCEI where the task of digitizing the record would take place. Not surprisingly, the consolidated climate record for a month was not available until many months after the fact.
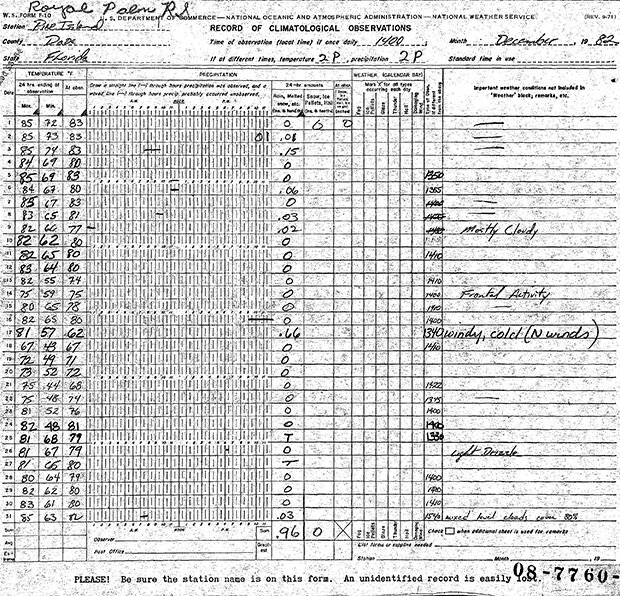
Before the Internet, cooperative observers recorded their observations on paper forms, like this one from Royal Palms, FL, from December 1982. Observers mailed their forms to NOAA. NOAA photo courtesy NCEI.
Today’s observers transmit their observations each day via the internet. They are used to support National Weather Service forecasts and warnings, and they are collected, quality controlled, and used at NCEI to provide perspectives on the nation’s varying and changing climate.
These observations are maintained as part of the Global Historical Climatology Network-Daily dataset at NOAA’s National Centers for Environmental Information. As the name implies, the GHCN-Daily dataset contains climate observations not only for stations in the U.S. but from countries around the world. But that is a story for another day.
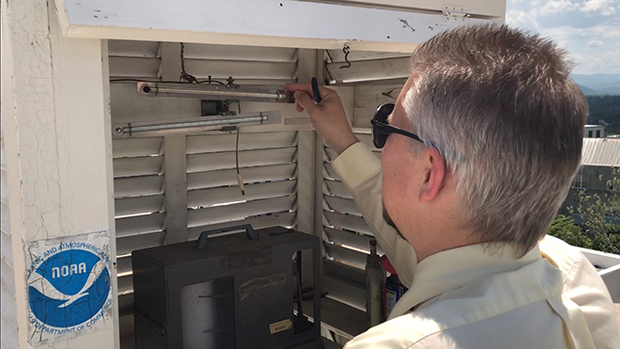
A modern COOP station in Asheville, NC. NOAA photo courtesy Jay Lawrimore.
One more thing. Those observations taken in the early to late 1800s. You may be wondering what happened to them. They are part of what is called the US Forts record (although not all were taken at Forts). Those observations were digitized in recent years as part of NOAA’s Climate Database Modernization Program. Some are already included in the GHCN-Daily dataset and hundreds more will be added over time.
References
Information taken in part from http://www.nws.noaa.gov/pa/history/signal.php , http://mrcc.isws.illinois.edu/FORTS/histories/CA_San_Diego_Conner.pdf , and http://www.weather.gov/coop/Overview.
Comments
Comments have been disabled on this article