CPC’s new week 3-4 temperature and precipitation outlook: a success story about bridging weather and climate
Please raise your hand if you know that the NOAA Climate Prediction Center (CPC) issues temperature and precipitation outlooks for weeks 3-4. I expect to see a lot of raised hands because Michelle briefly mentioned these products in her post last month. (Don’t worry, we’re very forgiving at the ENSO Blog if it slipped your memory.) These outlooks may not be as well-known as many of CPC’s other products because they have only been offered for a little over a year. This may raise additional questions. What factors allow forecasters to make temperature and precipitation predictions 3-4 weeks in advance? What are the challenges going forward?
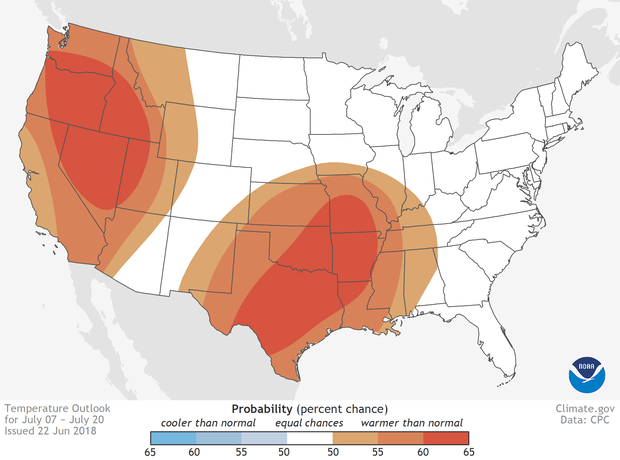
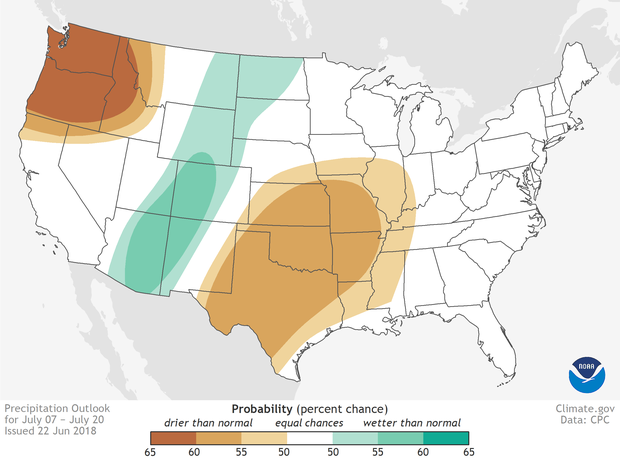
NOAA Climate Prediction Center (CPC) Week 3-4 Temperature (top) and Precipitation (bottom panel) Outlooks issued on June 22, 2018. Color shading indicates the probability of below or above average temperature or precipitation, not the magnitude of the projected anomaly. Large versions (click on images) include Alaska. Data from NOAA/CPC and modified by NOAA Climate.gov.
Pushing the forecasting frontiers
The CPC Week 3-4 Outlooks, which are released once a week (every Friday – set your reminder now!), provide probabilities that temperature and precipitation will be above or below normal (1) over the two-week period starting the 15th day after the forecast is issued. This new product, which started in May of 2017, eliminates a gap in CPC’s operational products between the 8-14 day and monthly outlooks. This product also makes CPC’s predictions more seamless, spanning a wide and nearly continuous range of time horizons from several days to several seasons.
Predicting weeks 3-4 has challenged climate scientists and forecasters alike because it lies just outside the sweet spots of accurate short-term weather and longer-range climate prediction. On the short-term side, as both Michelle and Emily explained in previous posts (here, here, and here), the details of the initial conditions and the ensuing chaos of the atmosphere have big impacts on weather forecasts through a principle popularly known as the “butterfly effect.” Basically, we would need to know all the tiny atmospheric details now, like exactly where and how a butterfly is flapping its wings, to predict big weather features, such as a tornado, three to four weeks later. Obviously, that’s too tall an order even with the most advanced prediction systems of today!
As readers of the ENSO Blog may know, this basic principle of chaotic weather does not prevent us from making skillful longer-range climate forecasts. When averaging over long enough time periods (like a season), the predictable signal from slower movements of the climate system (like ENSO) can emerge from the noise of chaotic weather. Because we are averaging, many of the daily weather variations associated with those tiny details in the initial conditions (like passing storms and sunny high-pressure systems) cancel each other out (2). For weeks 3-4 predictions, however, we can only average the chaotic weather variability over a two-week period – not long enough for most of those unpredictable weather variations to wash out.
So, all of this means it’s very challenging to make skillful Week 3-4 predictions: it’s far enough out that those initial butterfly-sized uncertainties make a big impact and not a wide enough time window to average out the resulting chaotic weather. This bridge between weather and climate has featured gaps in our understanding of the important physical drivers and necessary advances to produce useful forecasts at this intermediate timescale.
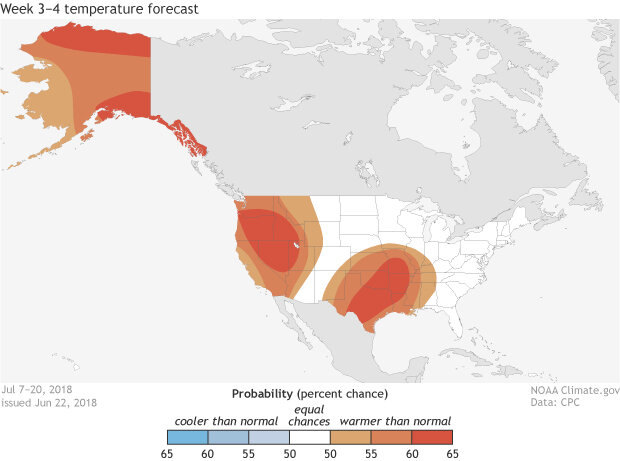
The temperature outlook for July 7-20 across the United States, issued on June 22. NOAA Climate.gov map, based on data from the Climate Prediction Center.
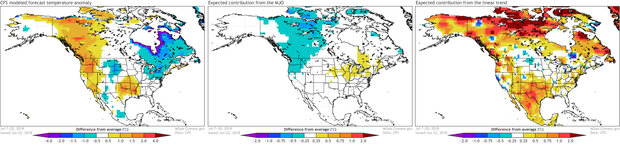
Three of the inputs that forecasters use for guidance for the week 3-4 temperature outlook: the CFS model output for the period, the typical temperature patterns associated with the state the Madden-Julian Oscillation is likely to be in, and the long-term trend. NOAA Climate.gov image, based on data from the Climate Prediction Center.
All hope is not lost!
Although the Week 3-4 prediction problem is recognized as a great challenge, many studies over the past few decades have called attention to promising sources of forecast skill at these lead times. In addition, our dynamical model forecast systems continue to improve, providing us with enhanced ability to take advantage of these sources of skill.
What are the phenomena that provide us with the opportunity to make temperature and precipitation forecasts in weeks 3-4? The good news is that we have covered many of the dominant factors already on the ENSO Blog. I’m hoping that you’ll be able to name at least one (hint: it’s in the title of your favorite blog). That’s right, ENSO! Though, the impacts of ENSO do not have as strong a signal-to-noise ratio (3) in weeks 3-4 that they do on seasonal timescales, but ENSO still is an important factor for the Week 3-4 Outlooks. Other important factors include the Madden-Julian Oscillation, long-term trends, the influence of sudden stratospheric warmings, and soil moisture. In short, it takes a team of factors working together to produce a strong enough signal in weeks 3-4 to stand out from the noise of chaotic weather variability.
By evaluating and combining different forms of guidance, CPC forecasters have been able to take advantage of these scientific advances in knowledge and computing power to generate this new Week 3-4 product. Like the ENSO forecast process, the forecasters consider both statistical and dynamical guidance (4). The statistical guidance incorporates historical observations to show how key factors, namely ENSO, the Madden-Julian Oscillation, and trends, are expected to influence temperature and precipitation in the weeks 3-4 forecast period. The dynamical guidance consists of the output from several dynamical models that use complex physical equations to make predictions. The forecasters throw these different forms of guidance into a blender, push the “on” button, and out comes a forecast! Okay, it’s a bit more nuanced than that. The forecasters must consider and weigh each factor carefully – you can read about the process in the forecast discussion section below each Week 3-4 Outlook.
Mission accomplished?
Now that it is officially a forecast product, have we solved the weeks 3-4 prediction problem? That would be going too far – there’s still work to be done. CPC’s Week 3-4 Temperature Outlooks have exhibited consistent skill, demonstrating their potential value and the justification for their introduction in May of 2017. Precipitation forecasts, however, are even more challenging, and the performance is less consistent. Therefore, there is hope that continued refinements in our knowledge and forecast systems will yield continued improvements in forecast performance, particularly for precipitation. The research and forecast communities have increased their focus on this problem over the past few years, so we should expect to bear the fruits of this labor in the years ahead.
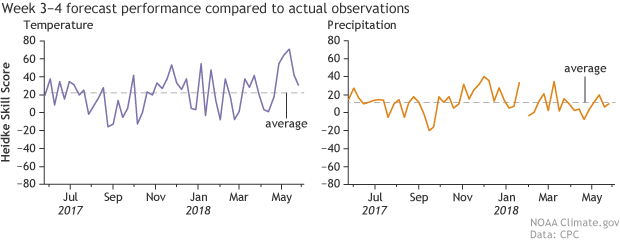
A common measure of forecast performance used by CPC, the Heidke Skill Score, evaluates how well each Week 3-4 temperature and precipitation outlook performed relative to the actual temperature and precipitation patterns that occurred. A score of 0 indicates that the forecast performed no better than what would be expected by chance. A score of 100 indicates a perfect forecast (see Tom’s post for additional information on the Heidke Skill Score). The typical performance of the Week 3-4 Temperature Outlooks (left panel) over the past year (average score of 22) is about twice as good as that of the Precipitation Outlooks (right panel, average score of 12). For the archive of Week 3-4 Outlooks and additional performance evaluations, check out this site. Data from NOAA/CPC and modified by NOAA Climate.gov.
The bottom line is, stay tuned for exciting new advances in this growing field and in CPC’s operational Week 3-4 products!
Footnotes
- The format of the Week 3-4 Outlooks is very similar to the seasonal outlooks we have discussed repeatedly on this blog, as well at the 6-10 day, 8-14 day, and monthly outlooks, except that the Week 3-4 Outlooks consider only two forecast classes (above or below normal) instead of three classes (above normal, near normal, or below normal).
- Although averaging across a month or season removes a great deal of the noise of daily and weekly weather variability associated with tiny uncertainties in the atmospheric initial conditions, we do not expect all this noise to average out completely. This is a big reason why monthly and seasonal forecasts must be expressed as probabilities.
- The “signal-to-noise ratio” is basically a nerdy name for the relationship of the expected impact of ENSO relative to the amount of variability unrelated to ENSO due, in large part, to the butterfly effect. This concept is covered further in this post. As discussed above, the noise of chaotic weather variability is larger in weeks 3-4 than in the seasonal average due to the shorter averaging length in weeks 3-4. Therefore, even if the ENSO signal is the same in weeks 3-4, the ENSO signal relative to the noise is smaller in weeks 3-4 due to the higher noise level.
- A brief discussion of the different dynamical and statistical models used in ENSO forecasts can be found in this post.
Comments
Add new comment