May 2021 ENSO update: bye for now, La Niña!
La Niña conditions have ended and NOAA forecasters estimate about a 67% chance that neutral conditions will continue through the summer. The ENSO forecast for the fall is less confident, with odds of a second-year La Niña currently hovering around 50–55%.
Spring cleaning
If you’ve been paying very close attention to the surface temperature of the tropical Pacific Ocean (and really, who doesn’t?!) you may have noticed that the April 2021 Niño 3.4 Index, at 0.75°C below average, still exceeds the La Niña threshold of 0.5°C below average. This is according to ERSSTv5, our primary sea surface temperature dataset.
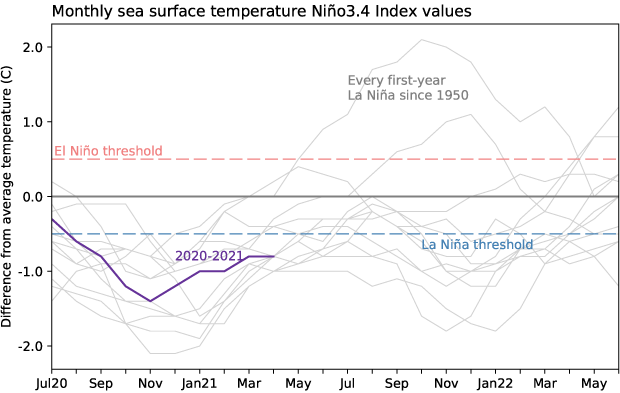
Monthly sea surface temperature in the Niño 3.4 region of the tropical Pacific for 2020-21 (purple line) and all other years starting from first-year La Niña winters since 1950. Graph by Emily Becker based on ERSSTv5 temperature data.
By the way, “average” is now calculated over 1991–2020. Check out the second half of this post for more on what that means for measuring ENSO, and this climate.gov post by our esteemed editor for what it means as far as US climate.
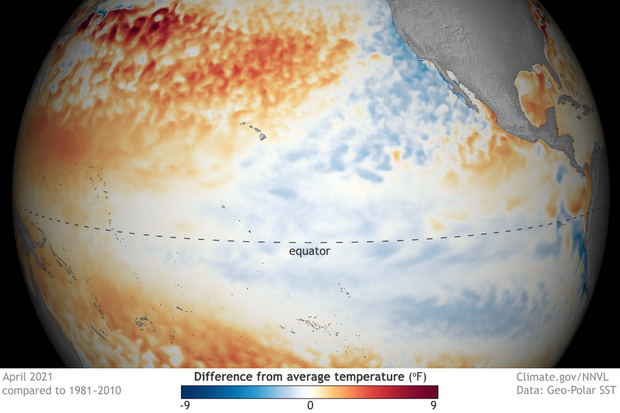
April 2021 sea surface temperature departure from the 1981-2010 average (note that this image still uses the previous averaging period). Image from Data Snapshots on Climate.gov.
However, as we know from long experience, ENSO (El Niño/Southern Oscillation) is more than just the ocean surface temperature anomaly (the difference from the long-term mean). The atmospheric component is just as important, as it serves to reinforce the surface temperature anomaly and transmit ENSO’s impacts across the globe. Over the past few weeks, atmospheric conditions over the tropical Pacific no longer resemble the strengthened Walker circulation pattern that we expect during La Niña.
That strengthened Walker circulation is characterized by reduced rain and clouds over the central Pacific and more over the far western Pacific and Indonesia. This pattern was evident for the past several months, especially the drier-than-average region over the central tropical Pacific, but has dissipated as of early April.
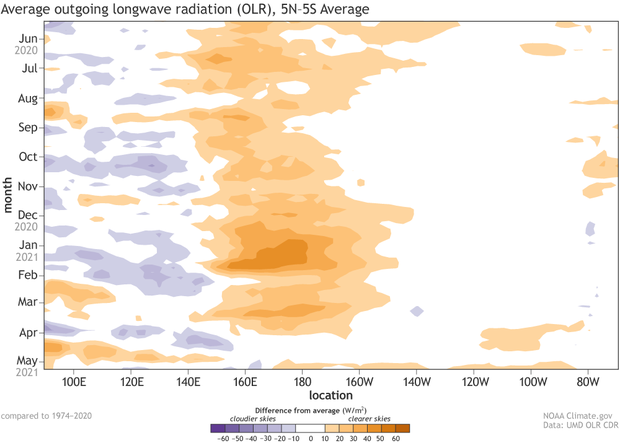
Outgoing long-wave radiation anomalies for the past year. Regions with more clouds and rain than average are shown in purple; areas with fewer clouds and less rain are shown in orange. Each row in this type of image is the departure from average (1974-2020) at that time. The drier-than-average signature of La Niña in the central tropical Pacific is visible as the large orange area that ends in April 2021. NOAA Climate.gov image, based on data provided by the Climate Prediction Center.
Other signifiers, such as stronger-than-average trade winds, have also diminished across most of the Pacific Ocean in the past month. The Southern Oscillation Index and Equatorial Southern Oscillation Index, both of which measure the atmospheric component of ENSO (more details here), are also indicating neutral conditions. Hence, the ENSO forecast team has concluded that La Niña is over, despite the sea surface temperature anomaly.
A sea surface temperature anomaly of -0.5°C (or, in the case of El Niño, +0.5°C) isn’t a magic switch that causes an instant atmospheric reaction, as we’ve seen many times before. For example, a couple of months preceding the last El Niño featured sea surface temperature anomalies near or slightly exceeding the thresholds, but a coherent atmospheric response didn’t kick in right away. The atmosphere-ocean system is vastly complicated, of course, and there are always many different things going on at once, so a delayed response isn’t surprising. As an atmospheric scientist, I’d actually be very surprised if the atmosphere coupling occurred immediately upon crossing the ENSO threshold!
Finally, the water below the surface of the tropical Pacific is warmer than average and a downwelling Kelvin wave is moving eastward under the surface. This means that there are limited sources of cooler-than-average water to replenish the surface over the next few months, adding some confidence that La Niña is done… for now.
Springboard
What everyone would like to know, of course, is what will happen ENSO-wise later in the year, following the neutral conditions that are likely to remain through the summer. ENSO has a strong relationship with the Atlantic hurricane season (June–November), with El Niño tending to lead to a reduced number of tropical storms and hurricanes, and La Niña tending to enhance the season. Last year’s extremely active Atlantic hurricane season was influenced by La Niña, so of course we’d like to get an idea of what’s ahead.
Let’s start with the easier case—chances that El Niño will develop are low, hovering around 8%. El Niño has developed following a first-year La Niña in the past, but we’ve only seen that happen twice since 1950, and most of the computer models give the development of El Niño similarly low odds.
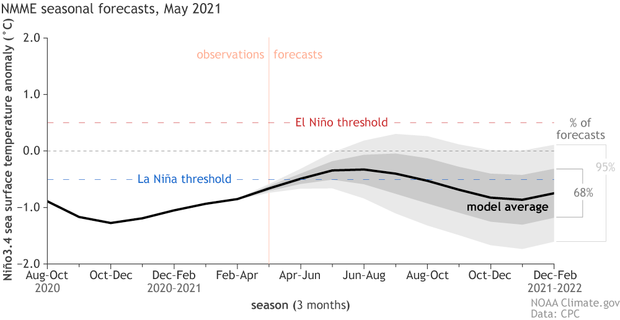
Climate model forecasts for the Niño3.4 Index. Dynamical model data (black line) from the North American Multi-Model Ensemble (NMME): darker gray envelope shows the range of 68% of all model forecasts; lighter gray shows the range of 95% of all model forecasts. NOAA Climate.gov image from University of Miami data.
A substantial amount of warmer-than-average subsurface water in the spring can sometimes give an early heads-up that El Niño is on the way, but this April’s average of 0.6°C is not particularly high, ranking 12th out of the 43 years we have on record. The February–April 2021 average is just about zero. Other springs with a similar value have been followed by El Niño, La Niña, or neutral in the subsequent fall. Our guest blogger Aaron Levine discussed springtime ENSO prediction—head over there for more details. So, to sum up: small chance of El Niño.
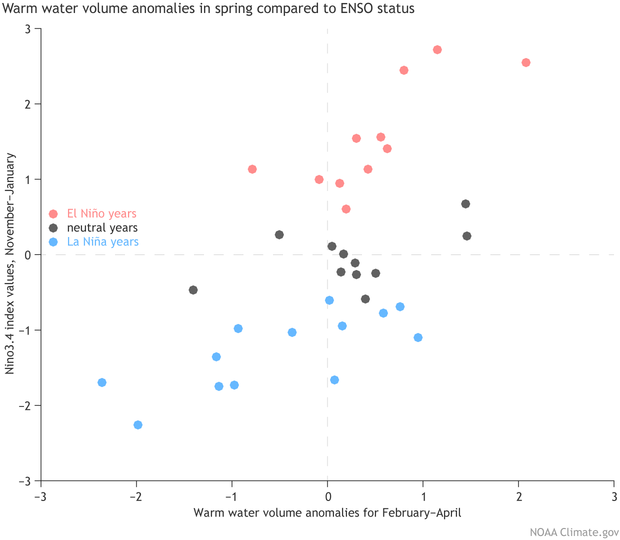
The Warm Water Volume anomaly during February-April compared against Niño-3.4 sea surface temperature (SST) during the following November-January. The La Niña years are colored in blue, the El Niño years in red, and ENSO-Neutral years in black. Large negative values of Warm Water Volume anomalies almost always lead to a La Niña event. However, large positive Warm Water Volume anomalies do not lead to El Niño events. For SST data, OISST is used. Warm Water Volume comes from the PMEL analysis (http://www.pmel.noaa.gov/elnino/upper-ocean-heat-content-and-enso). Figure provided by Aaron Levine and modified by Climate.gov.
The likelihood of La Niña versus neutral after the summer is less clear. Many of the computer models are suggesting that we may see a second-year La Niña, a common occurrence in the historical record (and a topic that Nat will be covering in his post later this month). However, the spring predictability barrier—forecasts made in the spring tend to be less skillful than forecasts made in other times of the year—is still in effect for May predictions, reducing the confidence in forecasts for the fall and winter.
Illustration by Emily Greenhalgh, NOAA Climate.gov.
(Editor's note from R.L.: I've added this image without Emily's express permission...because it's a cartoon, and who doesn't like a cartoon?
Currently, forecasters estimate the chance of La Niña during August-October, the heart of the hurricane season, at 42%, which is slightly lower than the 50% chance of neutral.
There are other factors at play in the hurricane season besides ENSO, including Atlantic Ocean temperatures. NOAA’s team is hard at work on the 2021 outlook, which will be released on May 20th.
Comments
about the zonal movement of a downwelling kelvin wave
Thank you for this great blog. I am simply wondering from the wording in this blog, saying "Finally, the water below the surface of the tropical Pacific is warmer than average and a downwelling Kelvin wave is moving westward under the surface." This is a little confusing to me because I think the downwelling Kelvin wave does move eastward, doesn't it?...
RE: about the zonal movement of a downwelling kelvin wave
Good catch! We'll get that fixed.
Typo
In this sentence from paragraph 8, I think westward be replaced with eastward: "Finally, the water below the surface of the tropical Pacific is warmer than average and a downwelling Kelvin wave is moving westward under the surface." See also slide 15 of CPC's ENSO update for 10 May 2021.
RE: Typo
Thank you! We will fix that.
Warm Subsurface water
Hey ther guys, first of all i'd like to compliment you all for (as always) the incredible blog content. My question is about the very warm subsurface water over the Pacific and how the models are not being influenced by this. It seems to me the models projections and the observed are a bit disconnected
RE: Warm Subsurface water
Thank you for the kind words and for your question! I think the answer relates to Aaron Levine's guest post, which demonstrates that the amount of warm subsurface water in the spring is not a reliable indicator of ENSO conditions in the following fall and winter, particularly when the warm water volume anomalies are relatively small and positive, like this year. With that said, I am not sure why so many of the NMME models are as confident about a return to La Nina as they are, although even those models indicate a wide range of outcomes, mostly between neutral and La Nina conditions. So, I do not think that the current subsurface ocean conditions preclude a return to La Nina by next fall, but I am also curious about what is driving some of the model forecasts.
historical data
Great page, as usual. My question is a general one about how current modeling attempts to account for non-linear climate change now being documented. (And I'm no climate scientist, so please pardon inadvertent inexactness, mis-use of technical terms, or other fumblings in this question.) But do models have built-in protocols to factor in the likelihood of conditions resulting from non-linear change — for example, the predictable effects onl air masses of rapid warming now underway in certain polar regions — or must we simply wait for 30-40 years, when climate "realities" resulting from these anomalies will have become part of historical norms?
England Set To Have Coldest May Since Records Began
Thank you for the blog. If the May temperatures continue in England, which they appear to be forecast to do, breaking the record for coldest May since records began in 1772, what would this say about climate predictions in general?
RE: England Set To Have Coldest May Since Records Began
Breaking individual records (either warmer or colder than normal) says nothing about long-term climate change or climate predictions in general. It's important not to confuse decadal and longer climate time scales with sub-seasonal to seasonal climate variability. The reality is that there will likely still be record breaking cold below normal temperatures from time to time, but there will be far more record breaking temperatures on the warm side of the ledger.
Downwelling Kelvin Wave in the equatorial ATLANTIC
Equatorial trade winds have relaxed with the decline of La Niña and a downwelling Kelvin wave is presently building up the heat content of the equatorial Atlantic ocean. It may be leading to an Atlantic Niño. It will be interesting to see how the heat content of the North Atlantic evolves this summer and how the hurricane season progresses. Atmospheric teleconnections have effectively transferred heat from the equatorial western Pacific and Indian ocean to the equatorial Atlantic over the past two months.
Not Your Typical La Nina in Texas
Here is my news story dispatched May 13:
La Niña has ended. That is the headline issued in a final La Niña advisory today from the National Oceanic and Atmospheric Administration's Climate Prediction Center.
The CPC's statement said that the ocean and atmosphere system reflected a return to ENSO-neutral where there is a 67% likelihood it will stay that way through meteorological summer June-August.
La Niña was only a limiting factor in North Texas weather since December and winter in Dallas-Fort Worth ended with near- to slightly below-normal temperatures. The current spring average temperature at DFW through May 12 is 63.93 degrees, compared to the season's normal average of 65.936.
Much of the influence in our weather in North Texas since December has been governed by the Arctic Oscillation, Pacific/North American teleconnection pattern and the Madden–Julian Oscillation. La Niña typically has yielded our warmest and driest winters as well as leading to among the hottest summers on record here.
Paul Ruekberg
NewsWatch Dallas
Earth science
Equatorial trade winds have relaxed with the decline of La Niña and a downwelling Kelvin wave is presently building up the heat content of the equatorial Atlantic ocean. It may be leading to an Atlantic Niño.
RE: Earth science
You may be interested in the article on Atlantic Ninos here:
https://www.climate.gov/news-features/blogs/enso/do-you-know-el-niño-has-little-brother
El Niño /el nins
Dear Sir
Please do you have update of the El Niño / El Nina in Asia.
Could I have your prediction and graph on the climate changes.
EDUARD CHONG
RE: El Niño /el nins
I suggest checking out the IRI map room here for global seasonal outlooks:
https://iri.columbia.edu/our-expertise/climate/forecasts/seasonal-climate-forecasts/
Question
Great Article! please could you tell me what those years were?
"El Niño has developed following a first-year La Niña in the past, but we’ve only seen that happen twice since 1950"
Submitted by michelle…
We have a table of historical episodes here that may be useful:
https://origin.cpc.ncep.noaa.gov/products/analysis_monitoring/ensostuff/ONI_v5.php
Southwest USA
With La Niña ending, will there be any impact on the Monsoon season?
RE: Southwest USA
WIth La Nina ending, that means that the influences on the Monsoon from ENSO will be limited. That doesn't mean that other atmospheric patterns can't cause a wet or dry monsoon. Check here to see the latest seasonal outlook from the Climate Prediction Center. https://origin.cpc.ncep.noaa.gov/products/predictions/long_range/
La Nina
Lets hope La Nina does not make a return in the fall/winter otherwise California could be in a pretty dire situation with another major prolonged drought. Hopefully next fall and winter will see some real storminess into the central west coast and help replenish our snowpack and water supply. We had great winters in 2017 and 2019. Otherwise most of the last decade was very dry and drought years. We also haven't had a full basin major strong El Nino in quite some time. Interestingly enough the winter of 2004/2005 brought over 38 inches of rain to Los Angeles and that wasn't even an El Nino year. The last major powerful El Nino was the 1997/1998 event.
Indian Ocean Dipole
What effect does a positive ENSO have on the IOD or vice versa
RE: Indian Ocean Dipole
For info on the IOD and ENSO, check out Nat's post.
next el nino?
really like your predictions and science explanations for us laypeople. As a fanatic West Coast fisherman I was wondering when there might be another El Nino along the West Coast? The fishing is always fantastic during Ninos.
RE: next el nino?
Check out our ENSO blog with regularity and I promise you'll be up to speed on what is next!
https://www.climate.gov/news-features/department/enso-blog
Comments have been disabled on this article